
View
Multi-Asset


Capital is at risk. The value and income from investments can go down as well as up and are not guaranteed. An investor may get back significantly less than they invest. Past performance is not a reliable indicator of current or future performance and should not be the sole factor considered when selecting funds.
By selecting intermediary or institutional investor I confirm that I am a financial professional and understand that the information should not be distributed to or relied upon by any other persons. It’s provided for general information purposes only and is not personal advice to anyone to invest in any fund or product. Information taken from trade and other sources is believed to be reliable, although we don’t represent this as accurate or complete and it shouldn’t be relied upon as such.


As a keen gardener, I’ve learned timing is essential. The best time to plant seeds tends not to be in the summer, when everything is in full bloom, but in the spring, when the UK’s weather is still unpredictable.
The same can be true of markets. The most attractive opportunities are often found not when stock markets are rising consistently and investor confidence is strong, but when things are uncertain and many investors are sitting on the sidelines.
The conflict in the Middle East and concerns about its impact on the global economy have caused turbulence in markets. However, for those taking a long-term view, the market pullback could also provide an opportunity.
We’ve been slowly building exposure to global smaller companies (also known as ‘small caps’) in many of our portfolios* for several months. We took the opportunity to add more last week because increased concerns about a global recession had hit the shares of small caps particularly hard.
While they’re a relatively small position in our overall portfolios, we believe global small caps deserve their place for a number of reasons. In our view, such businesses are strongly positioned to benefit from structural trends such as European countries investing more in defence and infrastructure, and huge spending by the US technology giants on artificial intelligence data centres.
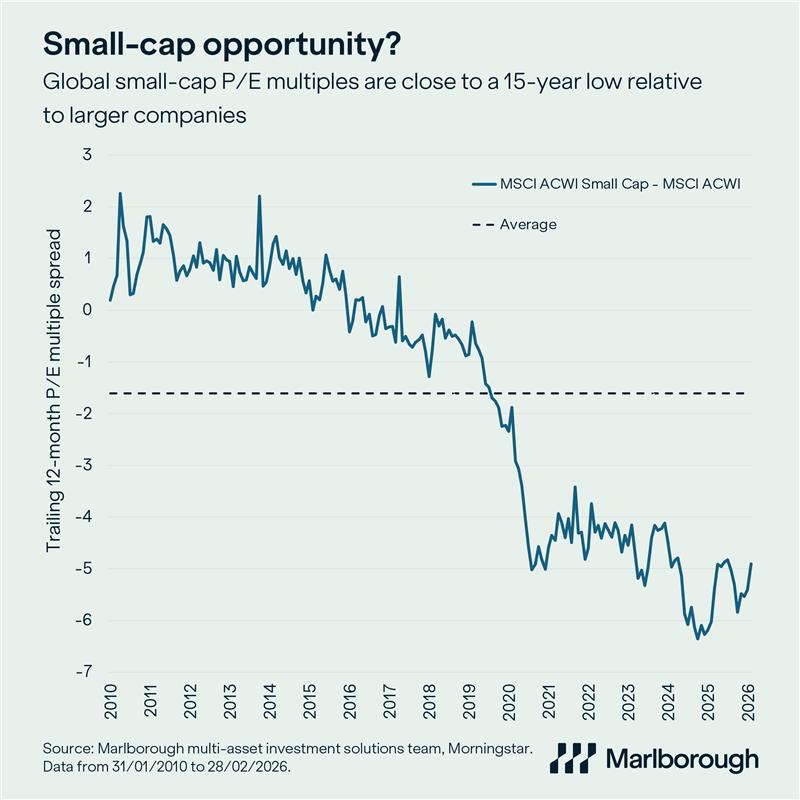
In addition, as our chart this week shows, valuations look attractive. One of the simplest ways to judge whether a stock appears expensive or cheap is by looking at the price-to-earnings multiple or P/E. The ‘P’ is the share price, and the ‘E’ is the company’s earnings (profits) over the past year. Divide one by the other and you get the P/E multiple. A lower P/E means you’re paying less for those profits (cheaper) and a higher P/E means you’re paying more (expensive).
Our chart shows that based on P/E multiples, the valuation of the MSCI All Country World Index (ACWI) Small Cap Index – which consists of more than 5,500 small caps around the world – is near its lowest level in 15 years compared to the MSCI ACWI Index, which is comprised of more than 2,500 large and medium-sized companies around the world.
The solid blue line represents the difference between the P/E multiples of the two indices (the spread). Historically, small caps tend to have higher P/E multiples, because investors are prepared to pay a premium for their growth potential. So, the spread is calculated by subtracting the P/E multiple for the ACWI Index from that of the ACWI Small Cap Index. This means the more negative the spread, the cheaper small caps are relative to large and medium-sized companies.
Over the past 15 years, the average has been a spread of approximately -1.6 (the dashed line on the chart). But since the pandemic, the spread has widened significantly, and at around -4.9 it is currently near its widest point over the period. This means that on this measure small caps look cheap compared to large and medium-sized companies.
As you’d expect, we’re continuing to monitor events in the Middle East very closely, and we’re carefully considering their likely impact on the global economy. If conditions deteriorate and undermine the appeal of global small caps then we’ll reconsider our decision. As things stand, however, we see value in a selective and measured approach to opportunities that arise during a period of uncertainty like this.
We believe that in markets, just like in nature, the biggest opportunities are often to be found not when everything is in full bloom, but when things still feel a little uncertain. Our view is that those who take a patient approach are likely to reap the rewards over the long term.
*In our managed portfolio solutions (MPS) range, global small cap exposure is through the ‘dynamic core’. This means it will be included in our active and blended MPS portfolios, but not our passive portfolios.
This article is provided for general information purposes only and should not be construed as personal financial advice to invest in any fund or product. These are the investment manager’s views at the time of writing and should not be construed as investment advice. The opinions expressed are correct at time of writing and may be subject to change. Capital is at risk. The value and income from investments can go down as well as up and are not guaranteed. An investor may get back significantly less than they invest. Past performance is not a reliable indicator of current or future performance and should not be the sole factor considered when selecting funds.

