
View
Multi-Asset


Capital is at risk. The value and income from investments can go down as well as up and are not guaranteed. An investor may get back significantly less than they invest. Past performance is not a reliable indicator of current or future performance and should not be the sole factor considered when selecting funds.
By selecting intermediary or institutional investor I confirm that I am a financial professional and understand that the information should not be distributed to or relied upon by any other persons. It’s provided for general information purposes only and is not personal advice to anyone to invest in any fund or product. Information taken from trade and other sources is believed to be reliable, although we don’t represent this as accurate or complete and it shouldn’t be relied upon as such.


When I was younger, my sport of choice was boxing. Anyone who has stepped into the ring will tell you the same thing. It’s an extremely high-intensity sport that demands a level of fitness that you cannot truly replicate in training. No amount of running, skipping or pad sessions can quite prepare you for going toe to toe.
Which brings me neatly to investing, and today’s stock market ‘prize fighters’, particularly artificial intelligence (AI) related companies such as Nvidia.
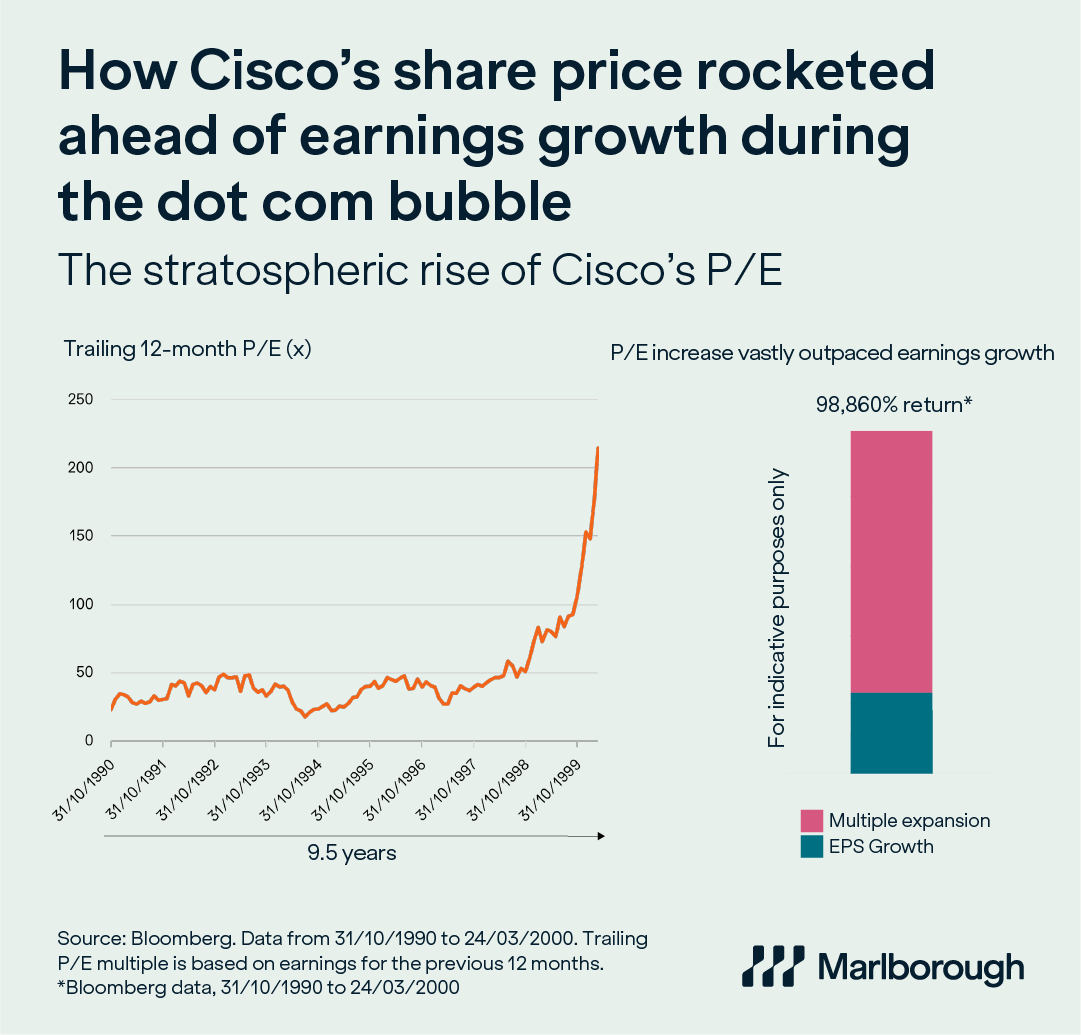
This week’s charts compare Nvidia’s valuation and profits growth with those of Cisco during the dot com stock market bubble.
One of the simplest ways to judge whether a stock looks expensive or cheap is by looking at the price-to-earnings multiple or P/E. The ‘P’ is the share price, and the ‘E’ is the company’s earnings (profits) over the past year. Divide one by the other and you get the P/E multiple.
If a company trades on a P/E of 20x, you’re effectively paying £20 for every £1 of profit. A lower P/E means you’re paying less for those profits (cheaper) and a higher P/E means you’re paying more (expensive).
The charts below highlight a crucial difference between Cisco and Nvidia. In the late 1990s, Cisco’s share price surge became detached from its underlying earnings. This drove up the P/E to a stratospheric 216x (as shown in the chart on the left). This increase in the P/E or ‘multiple expansion’ vastly outpaced the growth in earnings-per-share (EPS) achieved by Cisco (as shown in the chart on the right) over the same period. The disconnect between share price and earnings was a key reason why the bubble ultimately burst.
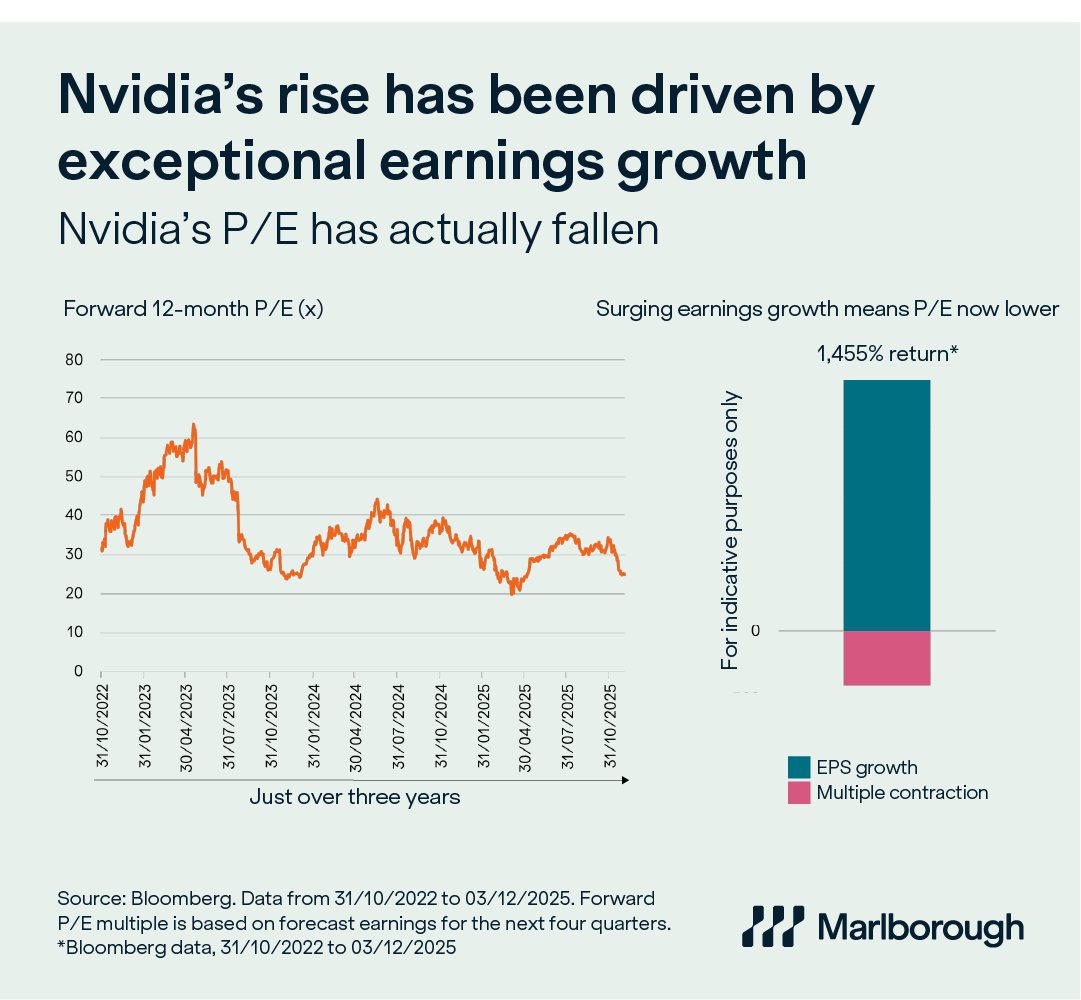
Nvidia’s share price rise, by contrast, has been driven by exceptional and accelerating earnings growth. As shown in the chart on the left below, the strength of this earnings growth means the P/E multiple has actually fallen (‘multiple contraction’) over the three years in which AI has really so far gripped investors’ attention. This is because in the P/E multiple, the ‘P’ has been outpaced by the growth of the ‘E’. The chart on the right underlines this point, showing powerful growth in Nvidia’s EPS over the three years, while the P/E multiple has actually fallen. It now stands at around 24x forecast earnings for the next four quarters.
The fact that Nvidia’s rising share price has been driven by earnings growth rather than ‘multiple expansion’ is an important distinction. It’s why we don’t view the recent wobble in AI-related stocks as a bubble bursting. Instead, it looks far more like a pause. A chance to catch a breath. Not collapsing but resting. Much like that vital time out between rounds, when even the strongest fighter needs to regroup before stepping back into the action.
And markets are never just about one fighter.
While some of the heavyweight names take a breather, we are already seeing a rotation into other areas of the stock market. There are always other contenders waiting for their moment. We believe the macro backdrop is now starting to favour them. With the US government taking steps aimed at supporting economic growth next year, and central banks expected to continue to cut interest rates, we believe the stage is set for a broader range of companies to perform.
The technology giants may yet return to the centre of the ring. However, they do not need to dominate every round.
One of the strengths of our multi-asset solutions team is the breadth of the insight we can draw on. This includes our Personal Portfolio team, who invest directly in individual stocks and study companies in detail. We also benefit from the expertise of the specialist external fund managers we work with every day. This knowledge helps us assess when positive progress in stock markets is supported by strong trading at company level and, just as importantly, when risks are building. In other words, it helps us stay invested while seeking to avoid the knockout punches.
This article is provided for general information purposes only and should not be construed as personal financial advice to invest in any fund or product. These are the investment manager’s views at the time of writing and should not be construed as investment advice. The opinions expressed are correct at time of writing and may be subject to change. Capital is at risk. The value and income from investments can go down as well as up and are not guaranteed. An investor may get back significantly less than they invest. Past performance is not a reliable indicator of current or future performance and should not be the sole factor considered when selecting funds.

