
View
The Bond Bulletin


Capital is at risk. The value and income from investments can go down as well as up and are not guaranteed. An investor may get back significantly less than they invest. Past performance is not a reliable indicator of current or future performance and should not be the sole factor considered when selecting funds.
By selecting intermediary or institutional investor I confirm that I am a financial professional and understand that the information should not be distributed to or relied upon by any other persons. It’s provided for general information purposes only and is not personal advice to anyone to invest in any fund or product. Information taken from trade and other sources is believed to be reliable, although we don’t represent this as accurate or complete and it shouldn’t be relied upon as such.


Leverage is a word you hear a lot in financial markets and it is definitely one of those terms with a very different meaning in financial circles compared to its use in the real world. When investors, analysts, journalists and financial market commentators talk about leverage they are not talking about information which can be used to influence or extort someone!
In simple financial parlance – leverage is debt. More accurately, it’s the amount of debt in context. Often it is referring to the amount of debt a company has relative to its equity. Simply looking at the notional value of a company’s debt without any context would be virtually useless because, of course, a company with annual revenue of £1 billion can afford to service a lot more debt than your local high street takeaway. Indeed, for large firms the amount of debt they choose to issue is mostly about optimising their sources of capital – and debt is normally cheaper to service than equity (paying an annual rate of interest is preferable to giving away a share of the profits).
Leverage is used in other contexts too. It is often used to describe the process of investors seeking to magnify investment returns with borrowing. Margin loans are a prime example. Your broker allows you to buy $10 worth of Apple shares using $9 of borrowed money that they will lend you and then charge interest. The appeal to the broker is that there is an additional source of income – the interest on these loans. The appeal to the investor is that this leverage can significantly magnify investment returns. In the above example, if the Apple shares go from $10 per share to $11 per share the investor who paid for the shares in full using their own money has made a 10% return ($1 increase in share price divided by the $10 starting price = 0.1 or 10%). The investor who availed themselves of their broker’s offer to lend them £9 of the $10 purchase price has achieved a return of 100%. This would be minus the interest they paid on the loan, of course, but it might not be very much if they are only holding the shares for a matter of days or weeks, which it seems they often are. In essence then, they invest $1 of their own money and made $1 from the appreciation of Apple shares. One divided by one equals one. In market parlance they were “ten times levered” and this magnified their return by 10x.
Derivatives – such as futures, swaps and options – are widely used, and increasingly by retail investors, as well as professionals, to achieve a similar effect on returns. Futures are a standardised contract in which one party promises to buy or sell a given asset at a given price at a specified date in the future. Swaps are an agreement to exchange two series of cashflows. Options are the right, but not the obligation, to buy/sell a given asset at a given price on or before a given date in the future. They can all be used to create the same leveraging effect as above. This is a sort of synthetic leverage (as opposed to the more “traditional” leverage using borrowed money).
Both concepts are known as leverage, and both are valid and widely used. Both are great when they work. Both can be financially fatal when they go wrong. In fact, it is ALWAYS leverage which turns a blip, a bump or a common or garden recession into a collapse or a crisis. Always. That doesn’t mean leverage is bad, but it does mean that we should pay attention to leverage and be cognisant of how it might affect corporate and investor behaviour. We should also be vigilant about where it might be creating vulnerabilities in specific corners of the economy and financial system – or indeed across the financial system as a whole.
Recent commentary about artificial intelligence (AI) and its powerful and growing effect on financial markets and the economy has subtly shifted over the last month or so. One of the most obvious ways that this debate has evolved involves the use of leverage. For most of the time since Chat GPT was launched in 2022, and during the subsequent race to build AI capability, capital investment (capex) has been funded from the massive cashflows and cash piles of the dominant Big Tech companies. Think Alphabet, Amazon, Nvidia and Meta (parent of Facebook) in the first instance, although there are others. These companies have exhibited profitability and cash generation on a scale hitherto unknown in human history over the last few years. Finding a potentially lucrative purpose for that capital has thus been overwhelmingly viewed positively by equity investors. We can leave all the questions about use cases, overinvestment, competition and depreciation cycles for another day. The point is that even if all this capex turns out to be wasted, because it was being funded overwhelmingly out of cash there is very little direct risk to the wider system.
In recent weeks that story has been changing. Some (not all) of these so-called “AI hyperscalers” have started to issue debt to raise the capital they need to continue investing heavily in AI capability and capacity (mostly, but not entirely, data centres and power generation). In and of itself, that is no immediate cause for concern – after all, as I described above – debt is often viewed as being a cheaper source of capital for companies than equity. The amount of debt for these massive tech firms is also still pretty small, when put in the context of their market capitalisation. Issuing tens of billions of dollars of debt when you have a market cap of over $1 trillion should hardly trouble the folk who own those stocks – particularly when debt levels were pretty low to begin with. At the margin, it might begin to raise the stakes a little – particularly when you see firms using off-balance-sheet “special purpose vehicles”. Meta, I am looking at you. Such methods were a feature of the Great Financial Crisis and, before that, of Enron’s spectacular demise. But is this the difference between a raging bull market and the end of days? Of course not.
The increased focus on the Big Tech companies’ use of debt. and a wider focus on leverage in general, has, however, led to a broader look at where we are, where we are going and the risks we are facing as investors. It is this aspect that I wanted to focus on here.
Bears will point to some high-profile defaults, evidence of financial irregularity or even fraud, rising delinquencies, elevated mortgage rates, historically expensive equity valuations, multiple signs of consumer distress among the lower income quartiles. They will say there are problems out there. Big Tech companies borrowing off-balance sheet and engaging in circular, vendor financing to invest in a highly speculative technology is probably in the mix too.
Bulls will point to solid ongoing economic growth, robust consumption, huge investment and future investment demand. They will stress the relative insignificance of lower-income consumers in the aggregate data and the eye-watering and ongoing profits and cash generation of the equity market’s biggest stocks. What has also been in the mix of late is some version of the chart below. In the eyes of the bullish beholder, this shows that the private sector has “de-levered”. What they mean by this is that US private sector, non-financial debt as a percentage of gross domestic product (commonly known as GDP – the amount produced each year in an economy) has fallen significantly over the last 10-15 years.
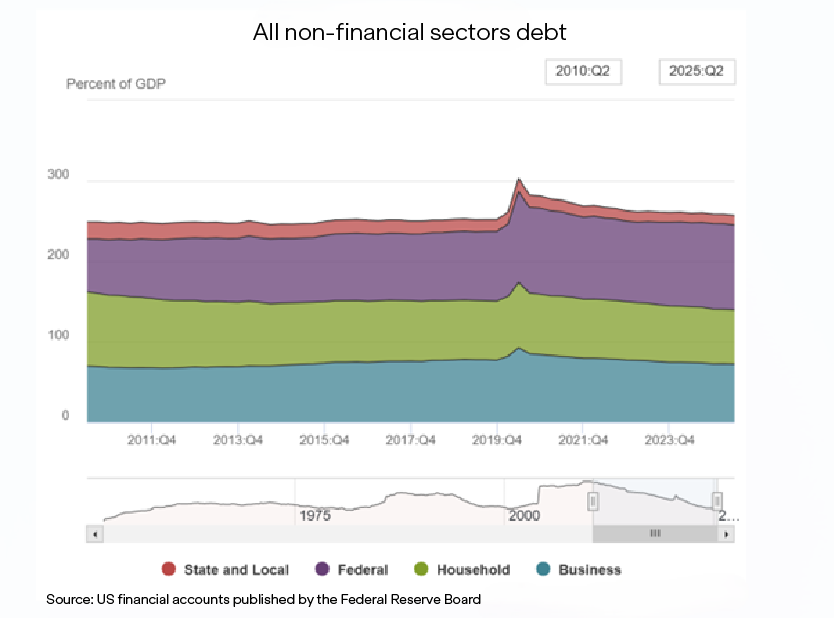
It is not necessarily easy to see the scale of changes in the chart, so here are the figures. In Q2 2010, household debt was 92.7% of GDP and non-financial corporate debt was 69.7% of GDP. Making total, non-financial private sector debt 162.4% of GDP.
It is worth noting that the financial sector is often excluded from these analyses because the high leverage of the banking sector creates distortions – particularly for smaller economies with large global financial centres like the UK, Hong Kong and Switzerland.
The most recent data in this chart is from Q2 2025. As of that date, household debt to GDP had fallen to 67.4% and non-financial corporate debt had risen slightly to 72.2% giving a total for the non-financial private sector of 139.6%. That is a decline of around 20% of GDP. However you slice it, that is a significant number.
On several occasions in recent weeks and months I have seen some version of a story which says – private sector leverage is the canary in the coalmine and thus if it has fallen then there can be nothing bad around the corner.
My assertion is that such a simplistic interpretation might be a little naïve at best or downright misleading at worst. Below, I am going to raise three rhetorical questions which dig a little deeper into the issue to try and get to a deeper truth about how we should view systemic leverage and the extent to which investors should feel comforted by this kind of apparent deleveraging. My intention is not to make the case that we are definitely teetering on the edge of something bad and we should all be running for the hills. I know that’s something we bond investors are generally known for, but on this occasion, I just want to counter a simplistic interpretation with some food for thought.
If I borrow £1m to buy £1m worth of equities and those equities rise in value by 100% - have I de-levered?
Technically the answer is yes, absolutely. However, I still owe the same amount of money to the lender and I am still paying the same amount of interest. Clearly, I now have the ability to sell £1m worth of equity and pay down the debt entirely. However, if I choose not to do that, then I must continue to service the debt in the same way as before. My situation is also still vulnerable to a large drop in the value of my assets or some other change in my ability to service the debt.
What about if everyone in the equity market is in a similar situation? Does that change the assessment of risk? If everyone is in the same situation and everyone decides to sell enough equity to raise the cash to pay down their debt – is it likely that the value of my assets will come out unscathed?
It occurs to me that there is a difference between a de-levering driven by a reduction in the nominal value of outstanding debt versus a de-levering driven by an increase in the value of the denominator. Furthermore, what if the rise in the denominator is significantly a function of the rise in leverage? If folk borrow lots of money to buy equities, causing the equity market to go up, that rise in equities can lead to a rise in consumer and business confidence. That can cause consumers to significantly increase their consumption and businesses to increase their investment, which causes an increase in corporate earnings. That, in turn, can drive a further increase in the equity market. This creates what looks like a virtuous de-leveraging cycle, up until the time the process goes into reverse.
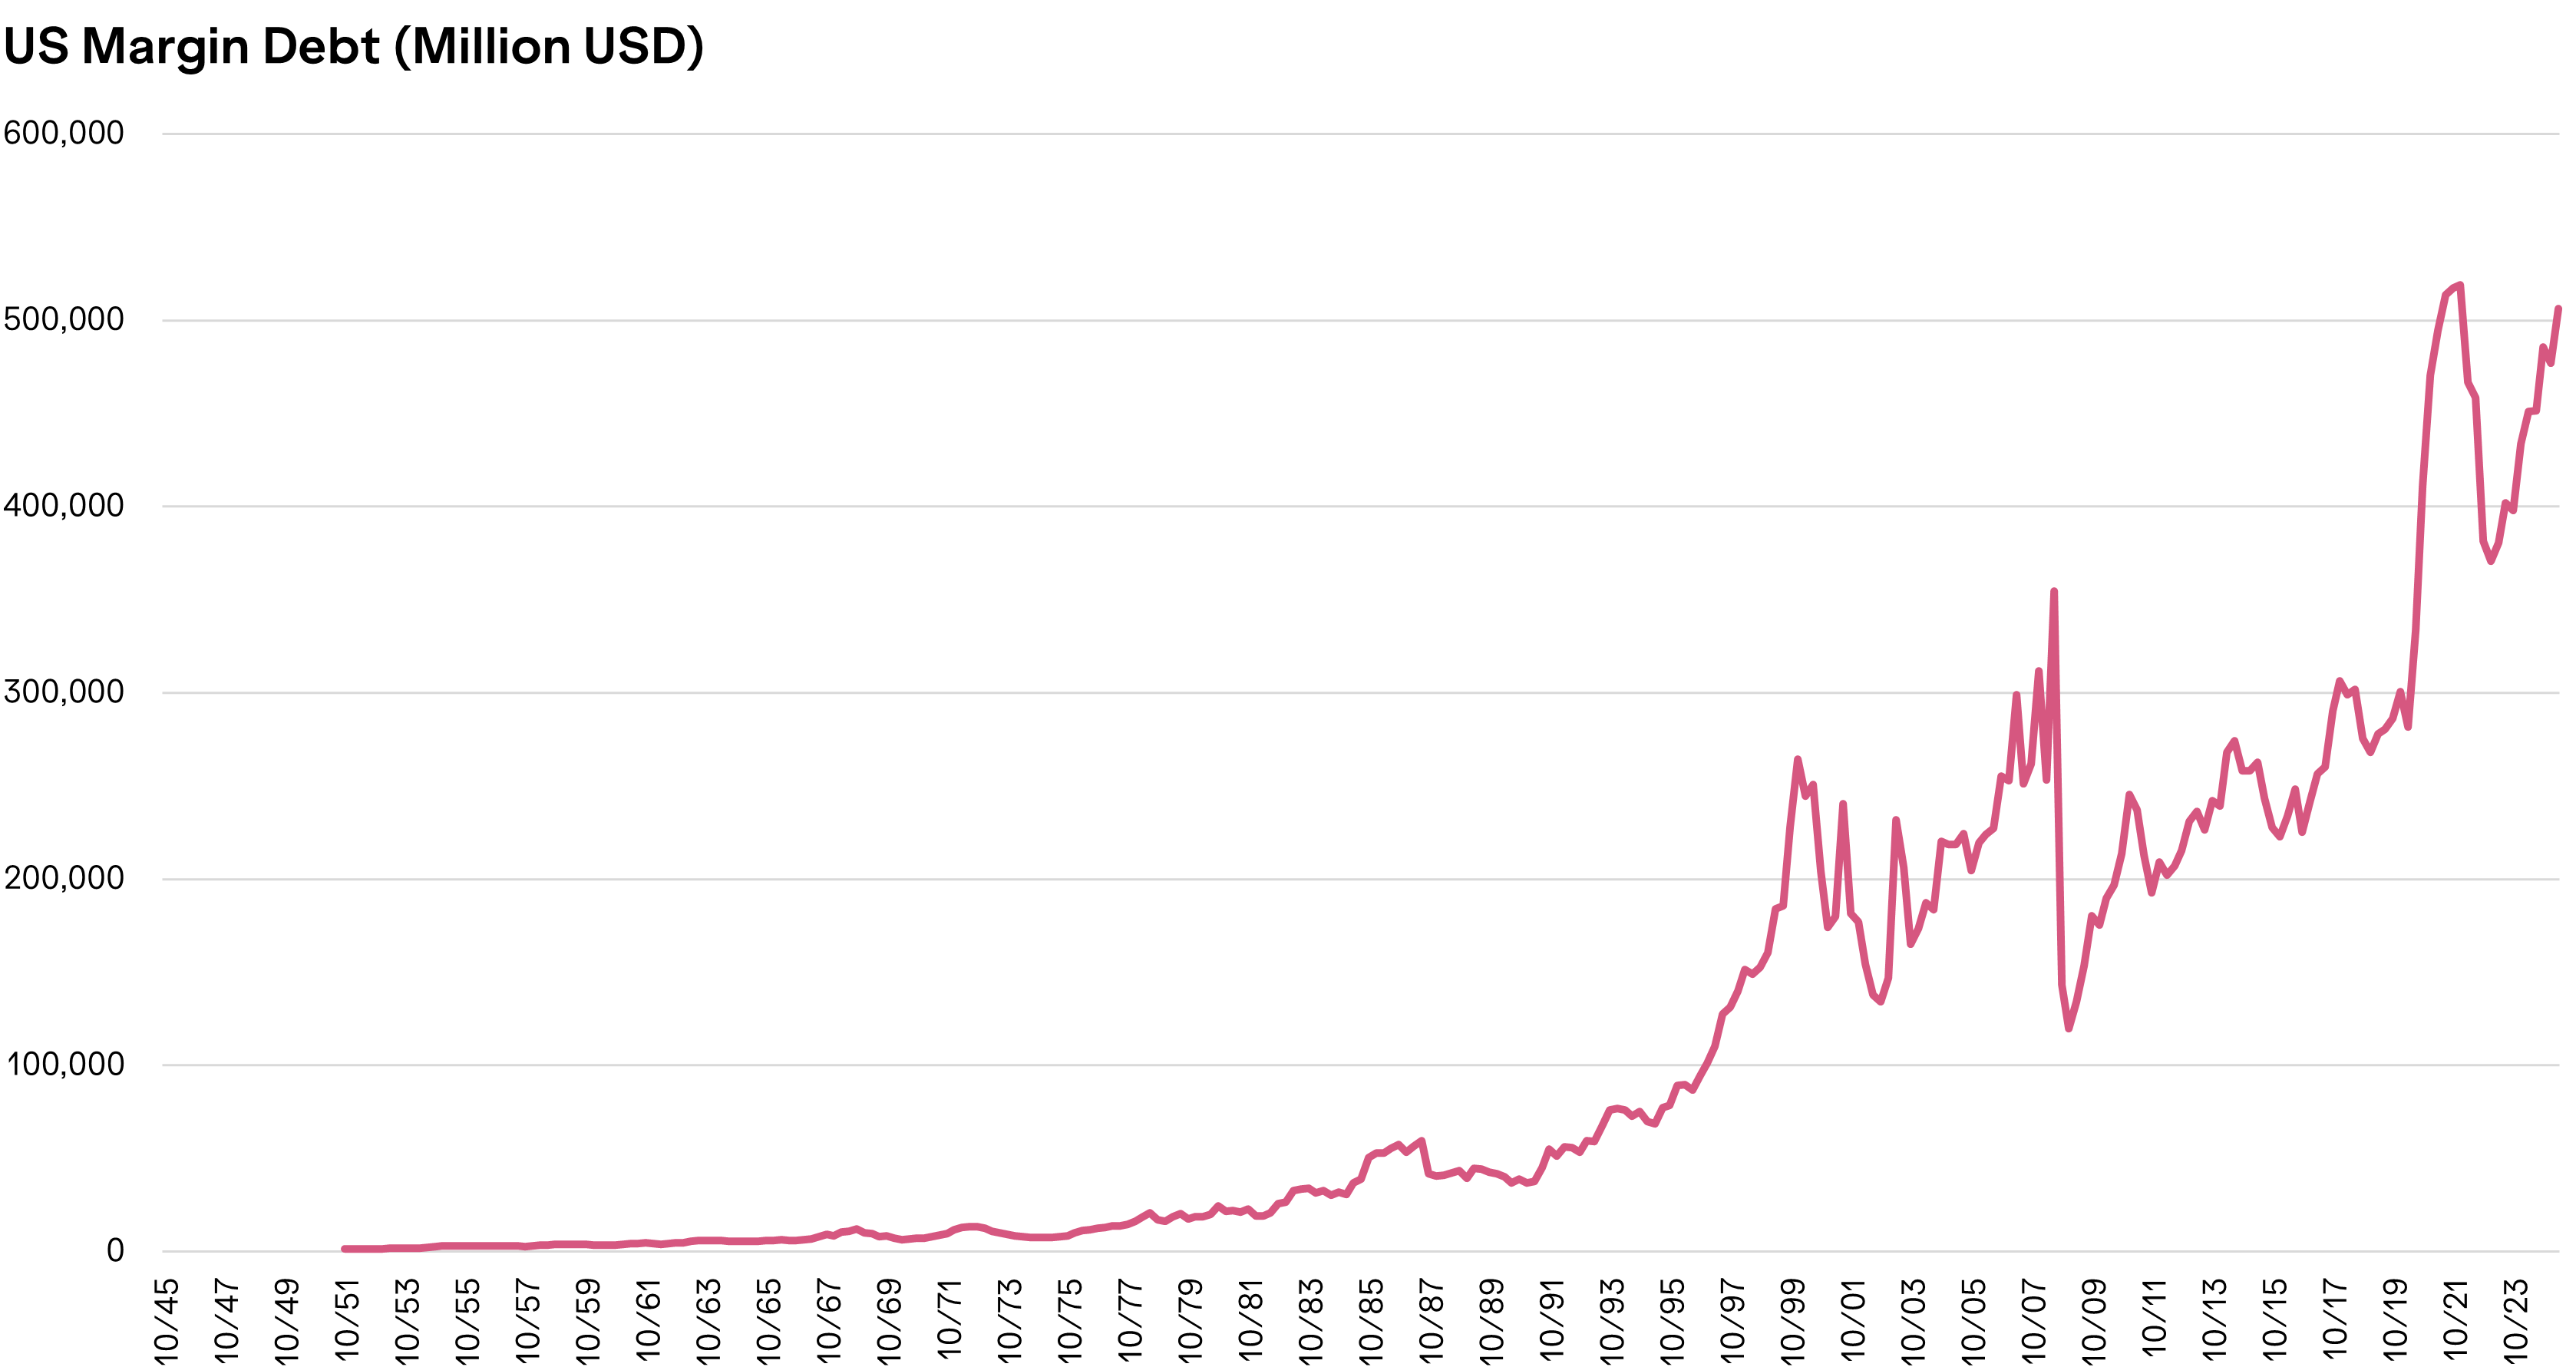
Below is a chart using Federal Reserve data showing security brokers’ and dealers’ receivables due from customers (up to and including Q2 2025). This is a metric which includes margin loans – i.e. money lent by brokers to their customers to buy stocks. Private sector debt as a percentage of GDP may have fallen, but the chart shows margin lending is as popular as ever.
Does it matter how the debt is distributed?
Consider this very simple, stylised example:
There is a population of 100 people. One person owns a business which employs the other 99. The 99 also buy the goods they need from that one company. In year one, the company has £100 of debt and each individual has 0 debt. The company pays each worker a wage sufficient for them to consume all that they need.
In year two, the company raises its prices, but not its wages. It makes a significant profit and pays down its debt. However, the 99 people can no longer afford to consume all that they want so they each take out £1 of debt to fund desired consumption that year.
In both year one and year two, there is around the same amount of debt. Is one situation better than the other? More robust? More fragile? What happens if year three is a repeat of year two? Given how successful year two was for the business owner, why would they not try again? How will the 99 service their debt in year three?
When something is not normally or evenly distributed, analysing aggregates and averages can be misleading. By some estimates, the wealthiest 10% in the US are now responsible for 50% of consumption. And the biggest five or 10 stocks in the S&P 500 account for 30-40% of market capitalisation and an even bigger share of profits. In this context, is it reasonable to assess whether average and aggregate statistics are giving a true picture of the health or vulnerability of the situation?
Is inflation good because it “inflates away” the debt?
This is always a bit of a tricky one and very much depends on who we are talking about. If we are measuring the system as a whole – i.e. the total private, non-financial corporate debt as a percentage of GDP chart that we looked at earlier – then, all else being equal, yes. If inflation rises, this will cause nominal GDP to rise (real GDP being a measure of output adjusted for changes in prices, whereas in nominal GDP there is no such adjustment). So unchanged debt divided by higher nominal GDP equals reduced leverage in the system which, on the face of it, is a good thing.
However, as an individual, that will not necessarily be how I experience these changes. Like many consumers my biggest borrowing is my mortgage and the way in which I experience this is via my monthly payment. This payment is significantly higher today than it was in 2021 – because of the rise in interest rates. Furthermore, what happens if my wages have not increased in that time, but the price of everything I want and need to buy has risen significantly? Then not only has the cost of servicing my debt gone up in nominal terms but it feels like it has gone up even more. This is because I have less discretionary income left over after taking care of the essentials. The system may look healthier, but I feel less financially healthy because servicing the debt is about interest rates and wages not prices and GDP.
Thank you for making it through my slightly tortured and very simplistic and stylised examples. They were designed to give an idea about why we, as a bond team, are not necessarily as comforted as others might be by the simple and appealing notion that private sector debt as a percentage of GDP today is lower in the US than it was a decade or more ago.
If you wanted me to bang the table with high conviction investment conclusions, I am very sorry to disappoint you. The situation we face today is about as unprecedented as I can recall in my nearly 25 years in this industry. We are always open to the fact that events can unfold in very different ways, depending on myriad and unpredictable factors, and we always invest accordingly. That means being brutally honest about what we do not know and cannot know. It also means investing where we are being compensated for the risks as we assess them and it means investing our clients' money as if it were our own.
This article is provided for general information purposes only and should not be construed as personal financial advice to invest in any fund or product. These are the investment manager’s views at the time of writing and should not be construed as investment advice. The opinions expressed are correct at time of writing and may be subject to change. Capital is at risk. The value and income from investments can go down as well as up and are not guaranteed. An investor may get back significantly less than they invest. Past performance is not a reliable indicator of current or future performance and should not be the sole factor considered when selecting funds.


