
View
The Bond Bulletin


Capital is at risk. The value and income from investments can go down as well as up and are not guaranteed. An investor may get back significantly less than they invest. Past performance is not a reliable indicator of current or future performance and should not be the sole factor considered when selecting funds.
By selecting intermediary or institutional investor I confirm that I am a financial professional and understand that the information should not be distributed to or relied upon by any other persons. It’s provided for general information purposes only and is not personal advice to anyone to invest in any fund or product. Information taken from trade and other sources is believed to be reliable, although we don’t represent this as accurate or complete and it shouldn’t be relied upon as such.


The concept of ‘normal distribution’ is a core tenet of statistical analysis. It was actually discovered by Abraham de Moivre but is most commonly associated with German polymath Carl Friedrich Gauss who popularised its use. For that reason, this statistical phenomenon is often known as the Gaussian distribution, while the graphical representation is popularly called the bell curve – because it looks like a bell:
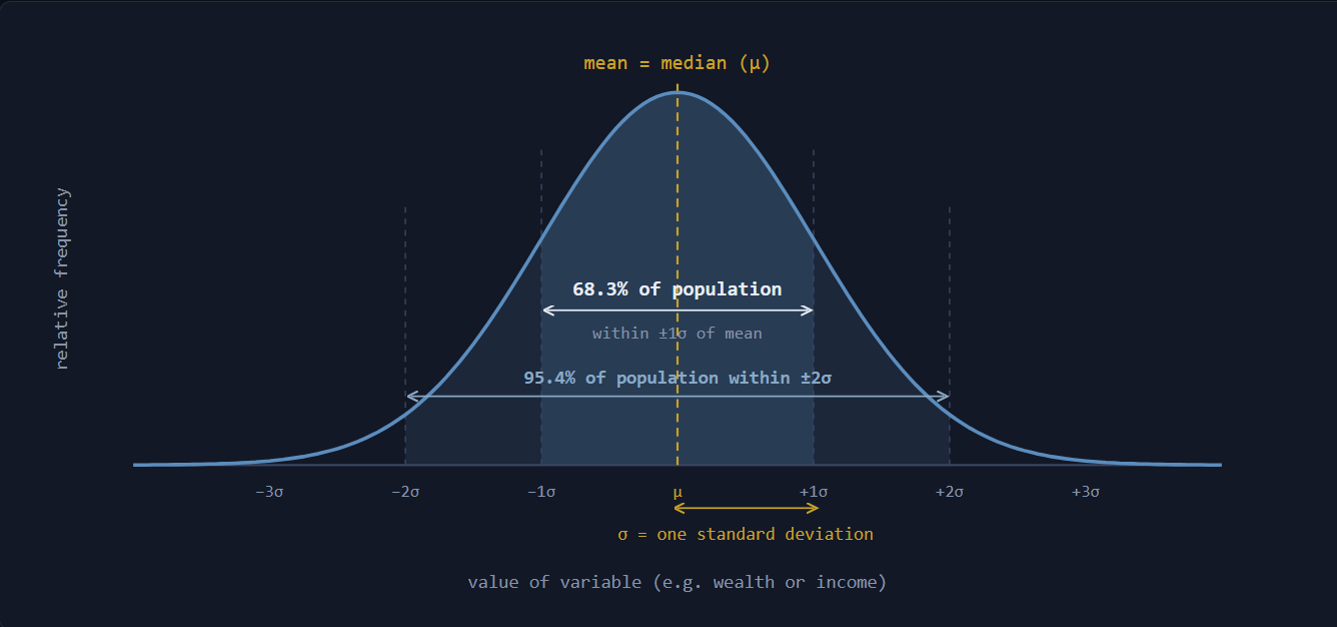
The bell curve accurately describes the distribution of a huge range of natural phenomena – specifically where randomness dominates. Take height for example. The global human population is normally distributed (when men and women are charted separately of course) meaning that the vast majority of people are close to the average in height. The further you get from average height the fewer and fewer people there are with such physical characteristics.
Randomness though is the defining characteristic. Therefore, non-natural phenomena can also be normally distributed. If you enlisted a million people to each toss a coin 100 times then the number of observed tosses which resulted in heads would be normally distributed – with a mean of 50 (because a coin toss is, quite literally, a statistical coin toss!). In fact, it was analysis of coin tossing which led de Moivre to this statistical discovery.
Financial markets have long embraced the bell curve. Not because there is a lot of normal distribution in financial markets. Far from it. It has been conclusively demonstrated time and time again that stock market returns, for example, are not normally distributed. If they were then things like the Black Monday stock market crash of October 1987 and multiple large days of drawdown during the GFC or the COVID pandemic would be, statistically speaking, expected to occur once in multiple lifetimes. Instead, we get multiple such days every five-to-ten years and generally bunched together. Stock market returns are thus said to have ‘fat tails’ – meaning there are many more observations at the extremes (i.e. very large moves either up or down) than would occur if they were normally distributed. In and of itself that is not a particularly concerning reality. The problems arise because in order to make all sorts of analysis, calculations and, particularly, risk models more straightforward, the industry assumes a normal distribution even though it knows that assumption is wrong. This leads to a situation where everything is fine, until it is not. The risk models and analysis seem perfectly reasonable and valid during ‘normal times’. Then everything goes to hell when we find ourselves in those tails – i.e. when markets start demonstrating statistically ‘non-normal’ behaviour. This a known problem but one which it is convenient for nearly everyone to ignore, then bemoan the situation when things go awry. I am not writing today to bemoan this convenient but wholly inappropriate financial industry assumption. Instead, today I want to talk about a similar, but implicit rather than explicit, assumption being made in economics and central bank circles.
At the margin
Economics is complicated. Macroeconomics infinitely so. Thus, much like their more practical cousins in the financial industry, academic economists (and thus by extension the vast majority of inhabitants of the world’s central banks) make simplifying assumptions to enable less complex and confusing calculations.
As discussed above, in finance that means assuming normal distribution where it does not exist. In economics that often takes the form of analysing change through averages and aggregates. Economics is often concerned with what happens ‘at the margin’. What the theoreticians mean by this is that by understanding what happens in response to incremental changes you can proxy the behaviour of the whole. A simple example: if the ‘next person’ loses their job then unemployment is likely rising and the economy is likely weakening. Vice versa if the ‘next person’ is moving from being unemployed into employment then the economic opposite is likely true.
Of course, we can never truly observe that marginal person and, most pertinently, people are individuals, with unique and complex characteristics. Psychology varies greatly of course but clearly there will be other behavioural and financial differences between young and old, people located in different locations, people working in different types of employment and myriad other factors. This is why I called macroeconomics ‘infinitely complex’. It is.
Economists do away with this complexity through assumption. They assume everyone is rational for starters. Hence it was such an inconvenience when Daniel Kahneman and Amos Tversky – two Israeli psychologists – conclusively proved that people are systematically NOT rational (including economists themselves). The Israelis were awarded the pseudo-Nobel Prize in Economics for their work on what they called Prospect Theory – a more accurate description of human behaviour and all the biases which are omnipresent across the population. Of course, economists have not really embraced this reality due to the aforementioned inconvenience of the discovery.
There are many other assumptions which are widely accepted within economic theory, most are explicit but one is less explicit. That is the assumption that all the differences described above are random, thus normally distributed and thus, to simplify the analysis, we can accurately model the marginal behaviour of a population by looking at the total or the average. That assumption is probably pretty solid for natural human phenomena – like psychology. It starts to look less valid for something like age, as economies around the world increasingly demonstrate lumps and bumps in the distribution of age across their populations. One place where it falls down, and falls down massively, is wealth.
Wealth is a stock; income is a flow. Both are important concepts in economics. Income clearly matters a lot because it significantly drives consumption for most people and consumption is the dominant driver of economic growth in most economies, particularly the large, developed ones. Generally speaking, if you earn more, you spend more. How much more of your increased income you consume is a concept known as the marginal propensity to consume (MPC). That which you do not consume you save and thus a related concept is the marginal propensity to save (MPS). They are expressed as decimals, and they add up to 1 (in economic theory terms, consumers have only two choices with respect to income – they spend or consume it or they save it). For example, if I earn an extra pound this year and I spend 90p of it then I have an MPC of 0.9 and an MPS of 0.1.
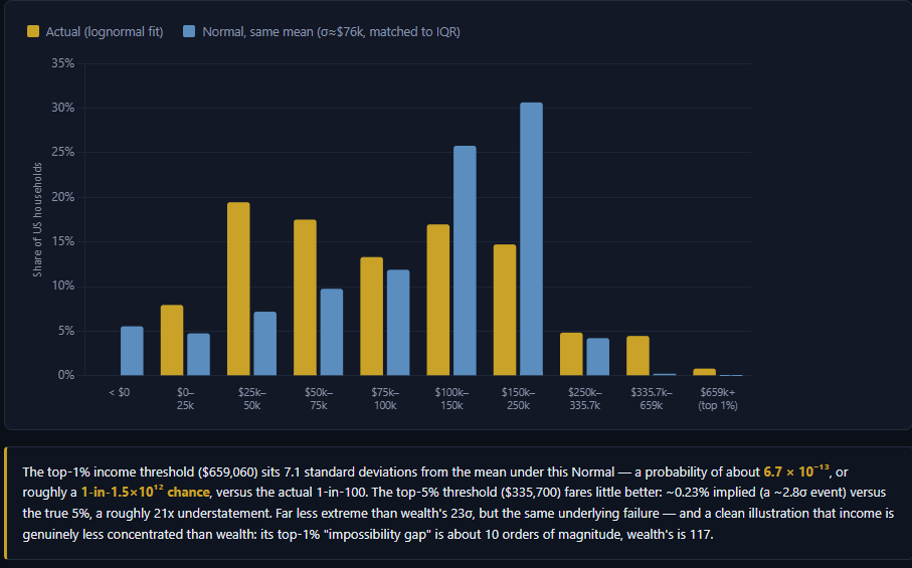
Income is not normally distributed. There are more people with low incomes and more people with very high incomes than would be the case were it normally distributed. The extent of that maldistribution is quite high. But wealth. Wow. Wealth, which can accumulate within and across lifetimes, is massively maldistributed. We can see this pictorially in the two charts below. The first shows the actual distribution of income in the US (the orange bars) versus the implied ‘normal’ distribution which would result in the same mean (average) income (the blue bars). Were income normally distributed then the likelihood of being in the top 1% income bracket as observed would be a 1 in 5 x 10¹⁴ chance (of course in fact those chances are 1 in 100). That is very unlikely. Although, to quote Jim Carrey’s character Lloyd Christmas in the 1994 comedy ‘Dumb and Dumber’: “So, you’re telling me there’s a chance!”.
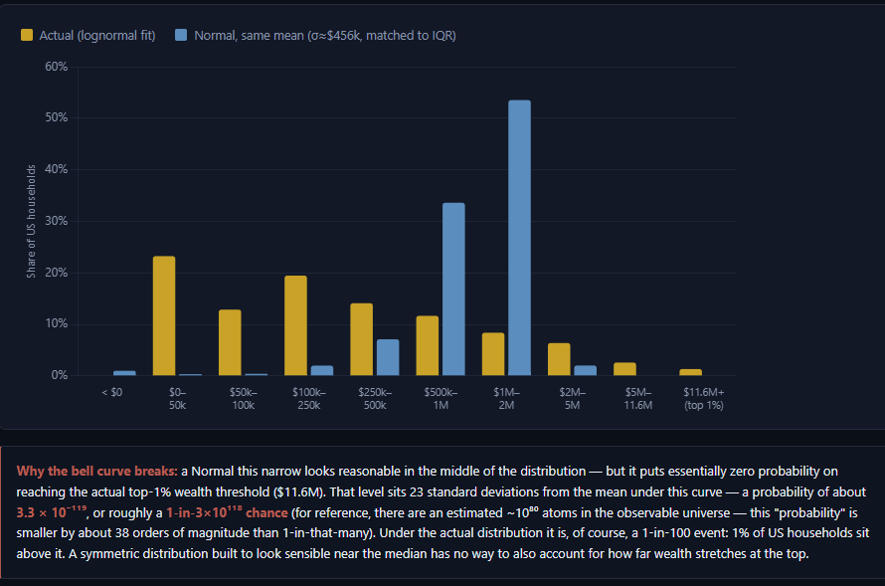
The second chart shows the same concept but using data on household wealth. The difference is huge. To put that difference in some kind of context – were wealth normally distributed then the likelihood of being in the top 1% wealth bracket as observed in reality would be a 1 in 3 x 10118 chance (that’s 23 standard deviations for the statistically minded among you) …. yes, that’s a 3 with 118 zeroes after it…. for reference there are an estimated 1080 atoms in the observable universe.
Here we get to the rub (finally! I hear you all sigh).
If you are a central banker trying to set monetary policy for the economy in aggregate, what role does this distributional issue play? The answer should be significant, but in reality, I fear it is vanishingly small.
Central bankers will often refer to consumption data, by definition an aggregate. It tells you nothing about the distribution of that consumption. 1% of the population buying hundreds of millions of dollars’ worth of ‘stuff’ every week while most people can barely afford to eat will not look any different at the aggregate level then a population all consuming a ‘normal’ amount of stuff.
Central bankers look at the savings rate to deduce information about consumer trends. But the savings rate is simply total income less total consumption. It doesn’t tell you if the quantity of saving is concentrated in a very small proportion of consumers while everyone else cannot afford to save because their wages are only sufficient to cover their basic needs.
The stock of consumer debt is assessed relative to GDP or to the size of the population – but what if the vast majority of that debt is concentrated among the poorest individuals who increasingly use credit cards to supplement consumption which they need but cannot afford from their wages.
If something as crucial as consumption is significantly impacted by concepts like wealth and income, and these economic characteristics are not normally distributed, then what does this say about the assumptions being made by theorists and practitioners such as central banks and what are the implications?
Central bankers and economic academics all like to talk of concepts like the ‘equilibrium or neutral rate of interest’ (the mythical and impractical r star or r*). This magical interest rate (which nobody can observe or accurately calculate) purports to balance saving and investment and allow the economy to operate at full capacity without generating inflation. It is almost like the economic secret of the universe, though for the benefit of fans of Hitchhiker’s Guide to the Galaxy author Douglas Adams, I suspect it is not 42.
Implicitly this concept suffers the same false assumption that we have already seen and discussed – that consumers and businesses either all face the same motivations and constraints with respect to interest rates. Or, more likely, it assumes that their differences are normally distributed and therefore cancel out on either side of the average. Therefore, the average is an acceptable proxy for neutrality.
Thus, as we sit here today, we see a number of central banks around the world contemplating interest rate hikes on the basis of robust consumption (an aggregate), solid or stable labour markets (an aggregate) and above-target inflation (an average – we all have consumption baskets which are different to the averages used to generate something like CPI therefore in reality we all have different lived inflation rates).
The data strongly suggests that these averages and aggregates are being massively distorted by the behaviours and actions of a relatively small number of incredibly wealthy/high income consumers (in fact a similar distribution is observable in companies too). In order to deal with this problem, central banks are prepared to use the blunt tool of interest rates. They are implicitly making things harder and harder (and more expensive) for the poorest and most indebted. They are doing this to try to exert some marginal influence over the average, which is dominated by those at the upper end of the distribution. These are people who increasingly behave in a way which is thoroughly disconnected from ‘normal’ economic forces. This increasingly looks like an approach which is statistically myopic, economically questionable and socially destructive.
So, what is the alternative? Well on that topic I think the views of new Federal Reserve Chair Kevin Warsh are interesting. Clearly a true diagnosis of how we got here is hard. However, there are many people, Mr Warsh and I included, who believe that this situation has been exacerbated at the very least by monetary policy – specifically balance sheet policy. Central banks have distorted financial markets, liquidity and the pricing of risk to such a degree and for such a long period of time that markets and the real economy have become disconnected. People whose wealth and income are derived from financial markets (the ‘K’ or capital share of GDP) have prospered, while people whose wealth and income are derived from the real economy (The ‘L’ or labour share) have suffered. The chart below shows this effect and is one I have had in my chart pack for years. It is interesting to me to note the number of well-known strategists and commentators who have recently taken to referencing it. It shows that owners of capital (think people who own companies or shares in companies) have taken a larger and larger slice of the economic pie, while workers have seen their share commensurately decline.
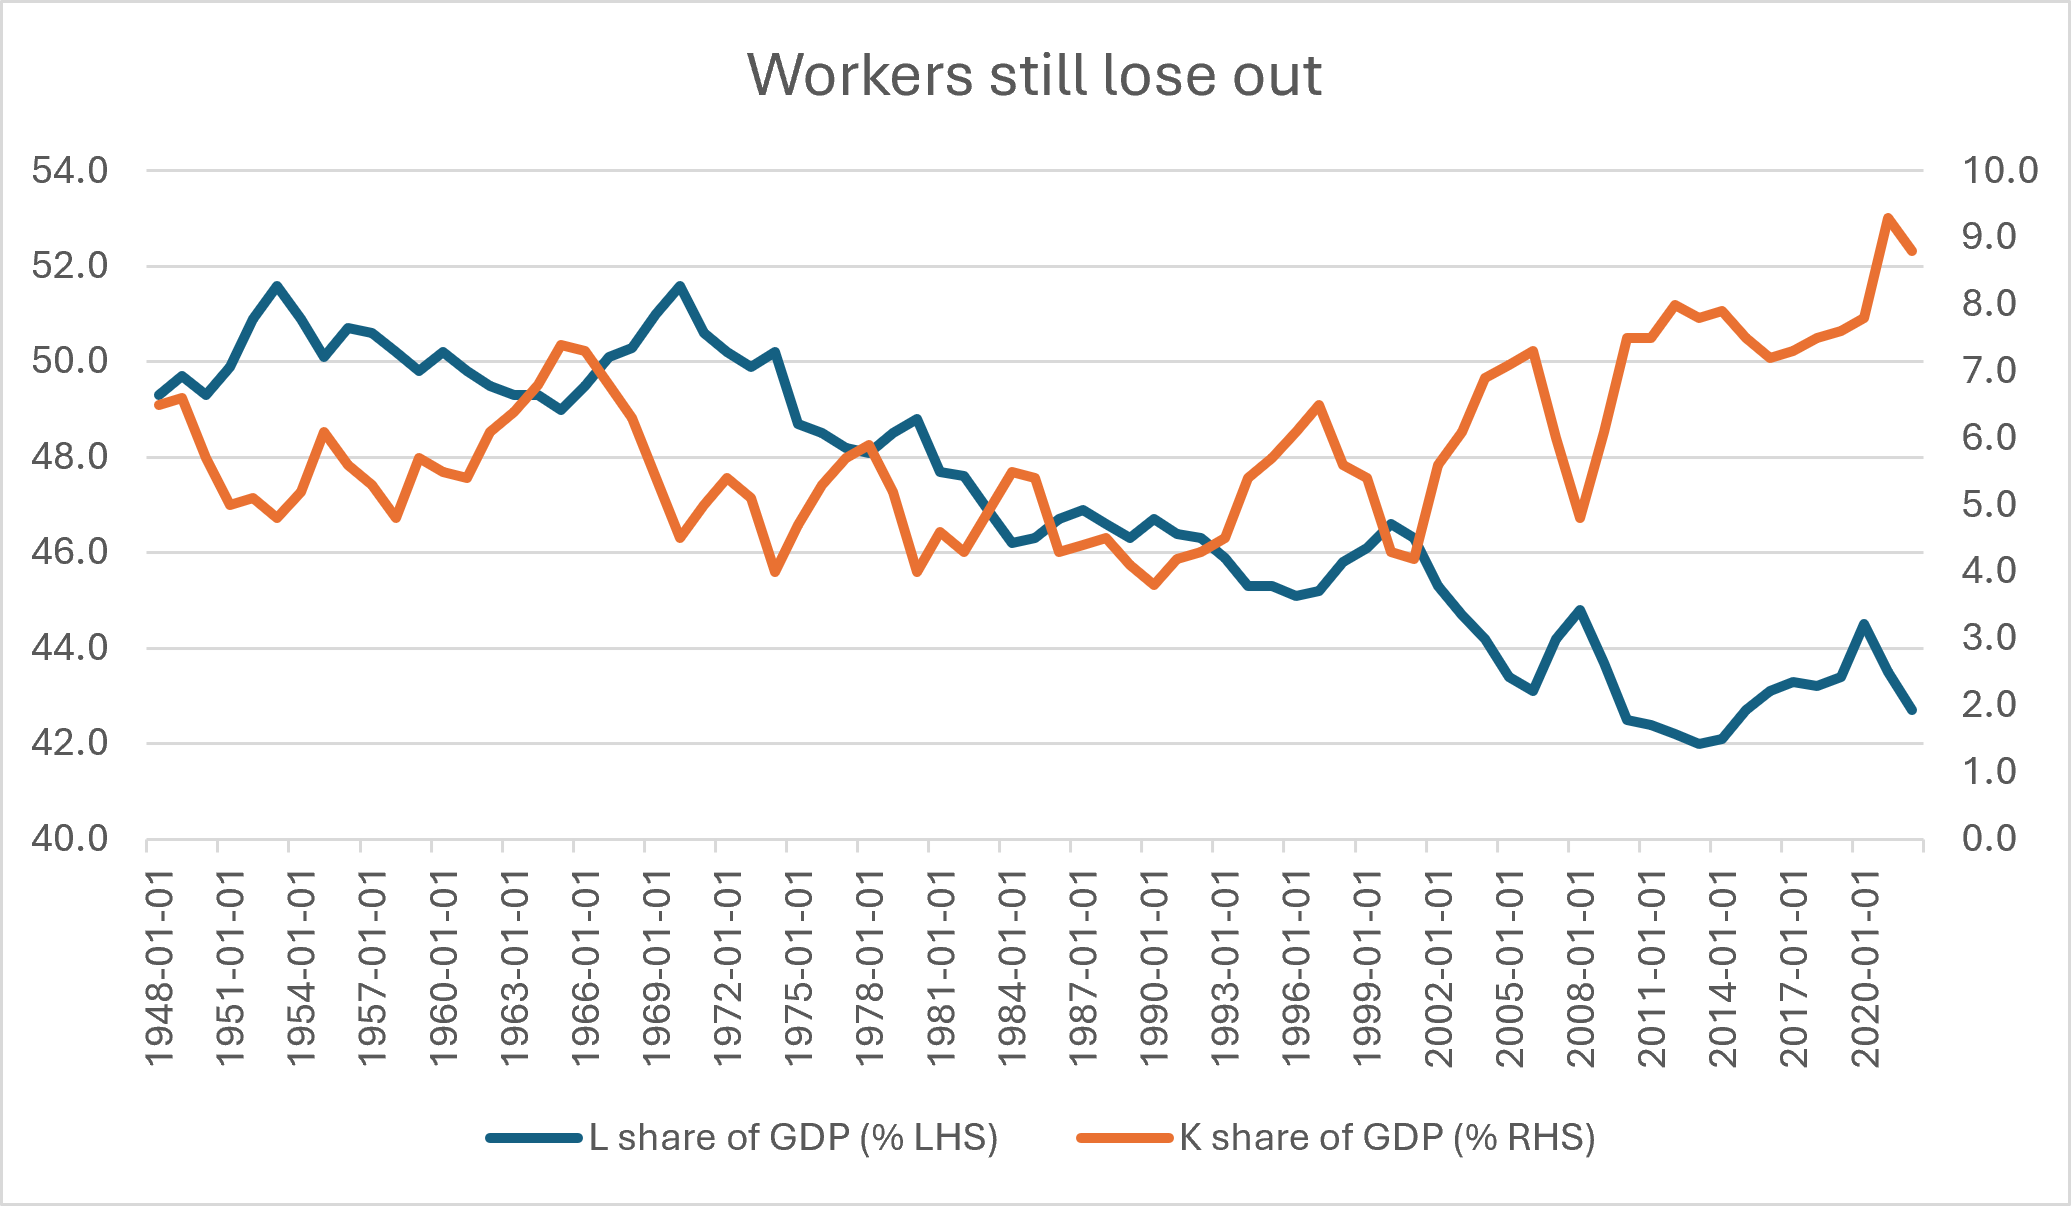
If Mr Warsh and I are correct, this distorted and distorting outcome is significantly the result of the accumulation of financial assets by the Fed and the other major global central banks over the last 20 years.
So, if the Fed, and others, wish to deal with the apparently inflationary aspects of the economy without being forced to drive the poorest 50% of the population towards poverty they need look no further than their balance sheets. Mr Warsh says there is too much liquidity for Wall Street and not enough for Main Street. I agree and from where I am sitting so does the data.
This article is provided for general information purposes only and should not be construed as personal financial advice to invest in any fund or product. These are the investment manager’s views at the time of writing and should not be construed as investment advice. The opinions expressed are correct at time of writing and may be subject to change. Capital is at risk. The value and income from investments can go down as well as up and are not guaranteed. An investor may get back significantly less than they invest. Past performance is not a reliable indicator of current or future performance and should not be the sole factor considered when selecting funds.


