
View
Multi-Asset


Capital is at risk. The value and income from investments can go down as well as up and are not guaranteed. An investor may get back significantly less than they invest. Past performance is not a reliable indicator of current or future performance and should not be the sole factor considered when selecting funds.
By selecting intermediary or institutional investor I confirm that I am a financial professional and understand that the information should not be distributed to or relied upon by any other persons. It’s provided for general information purposes only and is not personal advice to anyone to invest in any fund or product. Information taken from trade and other sources is believed to be reliable, although we don’t represent this as accurate or complete and it shouldn’t be relied upon as such.


My Uncle Joe is my bubble barometer. He has an uncanny knack for asking me about investments at exactly the wrong time. A great example? In 2007, just before the global financial crisis hit, he rang me up wanting to know how he could get into hedge funds. That was the peak of the frenzy.
Fast-forward to today, and the headlines are all about artificial intelligence (AI). The Bank of England even warned that we could be heading for an AI crash like the dot-com bubble of 2000. It raises the question: are markets getting ahead of themselves?
If we’re considering this, then a sensible place to start is valuations. One of the simplest ways to judge whether a stock looks expensive or cheap is by looking at the price-to-earnings multiple or P/E.
· The ‘P’ is the current share price.
· The ‘E’ is the company’s earnings (profits) over the past year.
· Divide one by the other and you get the P/E multiple.
Think of it like this: if a company trades on a P/E of 20x, you’re effectively paying £20 for every £1 of profit. A lower P/E means you’re paying less for those profits (cheaper) and a higher P/E means you’re paying more (expensive). Of course, fast-growing companies often command higher P/Es, because investors are willing to pay upfront today for bigger earnings expected tomorrow.
How does the dot-com bubble compare with today? At the height of the dot-com bubble, valuations were off the charts: Cisco was on a P/E of 216x, Oracle at 161x, AOL at 250x, and Yahoo! north of 1,000x. The top seven tech names averaged a staggering P/E of 276x.
Today’s ‘Magnificent 7’ US technology giants (Microsoft, Apple, Amazon, Alphabet, Meta, Tesla and Nvidia) are certainly not cheap, with an average P/E of around 70x and a median of 36x. But compared to the dot-com peak, they look tame. More importantly, these companies are profitable, cash-rich and dominant in their industries, not speculative start-ups burning through investor cash.
Our chart underlines the point, showing how high the P/E for the overall US technology sector had risen during the dot-com bubble and comparing that with today.
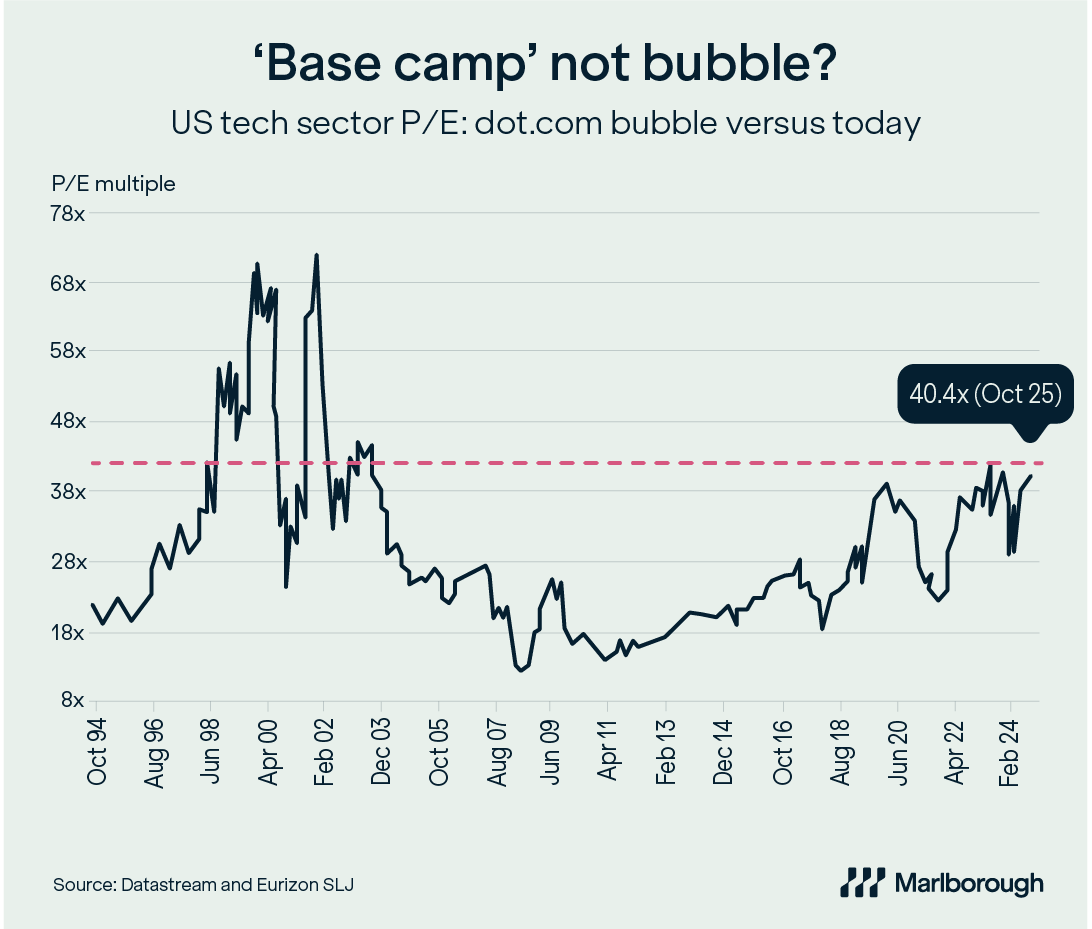
Yes, AI has been the big investment story this year and the market leaders have had a very strong run. But compared with 2000, we look more like we’re at base camp than at the summit.
And just to reassure you: my bubble barometer, Uncle Joe, hasn’t asked me once about AI.
This article is provided for general information purposes only and should not be construed as personal financial advice to invest in any fund or product. These are the investment manager’s views at the time of writing and should not be construed as investment advice. The opinions expressed are correct at time of writing and may be subject to change. Capital is at risk. The value and income from investments can go down as well as up and are not guaranteed. An investor may get back significantly less than they invest. Past performance is not a reliable indicator of current or future performance and should not be the sole factor considered when selecting funds.

