
View
Multi-Asset


Capital is at risk. The value and income from investments can go down as well as up and are not guaranteed. An investor may get back significantly less than they invest. Past performance is not a reliable indicator of current or future performance and should not be the sole factor considered when selecting funds.
By selecting intermediary or institutional investor I confirm that I am a financial professional and understand that the information should not be distributed to or relied upon by any other persons. It’s provided for general information purposes only and is not personal advice to anyone to invest in any fund or product. Information taken from trade and other sources is believed to be reliable, although we don’t represent this as accurate or complete and it shouldn’t be relied upon as such.


As we travel around the country talking to advisers and clients, one of the most common questions is about artificial intelligence (AI).
The question isn’t whether AI will be important, but whether investors have become too optimistic.
The concern is understandable. Technology companies are spending hundreds of billions of dollars building data centres, developing new AI models and expanding the supporting infrastructure.
This eye-watering level of capital expenditure is prompting genuine questions about what the eventual return on the investment will be. At the same time, investors are grappling with other concerns, including inflation, energy prices and conflict in the Middle East.
Yet despite all this uncertainty, stock markets remain close to record highs. So, what’s going on? Our chart this week provides an insight into what’s sustaining markets at these levels, despite the challenging backdrop.
One of the simplest ways to judge whether a stock appears expensive or cheap is by looking at the price-to-earnings multiple or P/E. The ‘P’ is the share price, and the ‘E’ is the company’s earnings (profits). Divide one by the other and you get the P/E multiple. A lower P/E means you’re paying less for those profits (cheaper) and a higher P/E means you’re paying more (expensive).
Our chart compares the P/E multiple of the US S&P 500 stock market index a year ago with where it stands this year. Last September investors were willing to pay around 23 times earnings (based on forecasts for the next 12 months). This September, that figure was around 19 times earnings, which is closer to its 10-year average.
It means investors are paying roughly 17% less for each dollar of earnings than they were a year ago.
The fall has been even sharper for the ten largest companies, many of them at the heart of the AI boom. Their P/E multiple has dropped from around 31 times earnings to around 21 times. That’s a drop of around 31%, nearly double the fall for the index as a whole.
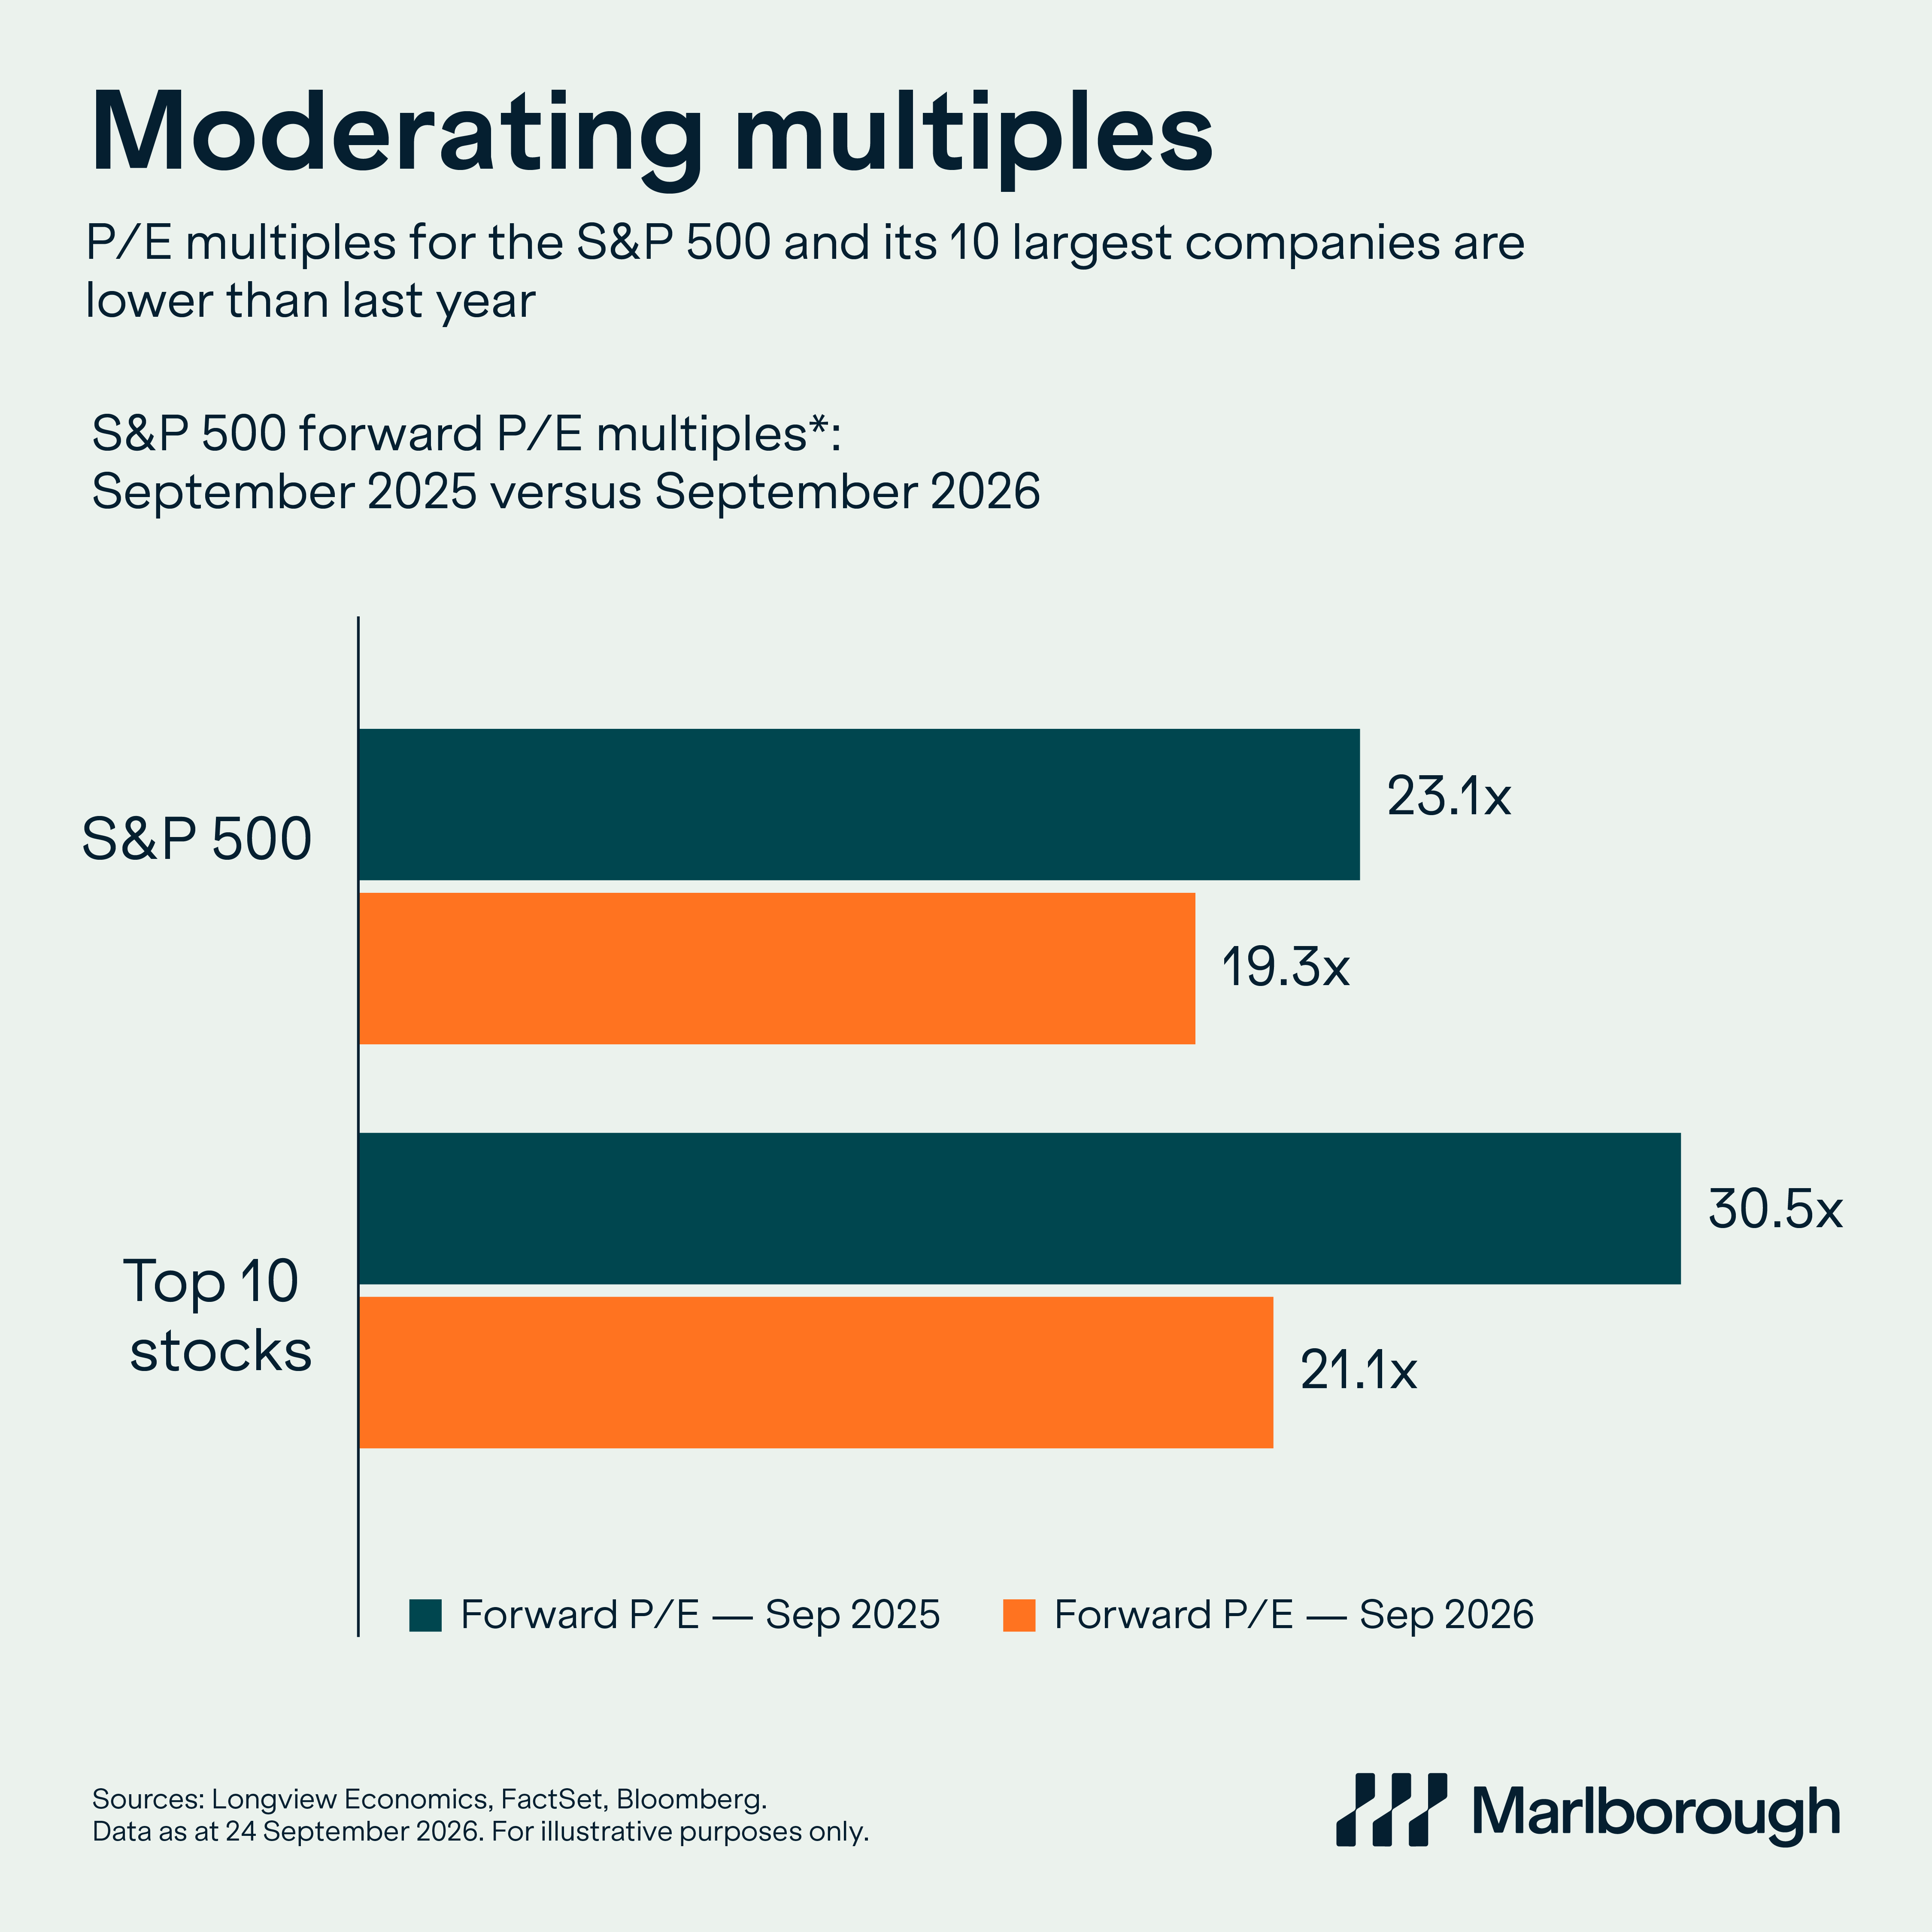
*Forward P/E multiple: current price divided by consensus forecast earnings per share for the next 12 months. Forecasts can change.
Forecast company earnings have continued to grow, but investors have become more cautious about how much they're prepared to pay for future growth. As a result, valuations have become more reasonable, even while markets have moved higher.
That's an important distinction. Rather than blindly pushing valuations ever higher, investors have become more selective and more demanding. The valuation of the market suggests a degree of scepticism has already been priced in.
The headlines may suggest investors are complacent. The valuation data tells a different story.
Markets are near all-time highs, but valuations aren't. That's because forecast earnings have continued to grow while investors have become more cautious about the price they're willing to pay for future growth.
Investing isn't about finding a future with no risks. It's about understanding whether those risks are already sufficiently reflected in today's share prices. The S&P 500’s lower P/E multiple shows the market has adopted a more measured stance. Many investors will see that as a positive sign.
This article is provided for general information purposes only and should not be construed as personal financial advice to invest in any fund or product. These are the investment manager’s views at the time of writing and should not be construed as investment advice. The opinions expressed are correct at time of writing and may be subject to change. Capital is at risk. The value and income from investments can go down as well as up and are not guaranteed. An investor may get back significantly less than they invest. Past performance is not a reliable indicator of current or future performance and should not be the sole factor considered when selecting funds.

