
View
Multi-Asset


Capital is at risk. The value and income from investments can go down as well as up and are not guaranteed. An investor may get back significantly less than they invest. Past performance is not a reliable indicator of current or future performance and should not be the sole factor considered when selecting funds.
By selecting intermediary or institutional investor I confirm that I am a financial professional and understand that the information should not be distributed to or relied upon by any other persons. It’s provided for general information purposes only and is not personal advice to anyone to invest in any fund or product. Information taken from trade and other sources is believed to be reliable, although we don’t represent this as accurate or complete and it shouldn’t be relied upon as such.


For those of you who’ve played fantasy football, you’ll know how much the game has changed over the years. Gone are the days when you’d pick a team based on gut instinct or a favourite player. Now, the difference between topping the league or languishing at the bottom can come down to poring over goals, assists, defensive contributions and a growing list of other stats.
Real-life sport has embraced data too. Football, cycling and golf all use analytics in the pursuit of perfection. It should come as no surprise then that, as an investment team, we too incorporate data into our process. It helps us make more informed decisions, reducing subjectivity and emotional bias. As artificial intelligence advances, data is likely to become increasingly central in virtually every walk of life.
But here’s the catch: if you feed in poor data, you get poor decisions. Garbage in, garbage out.
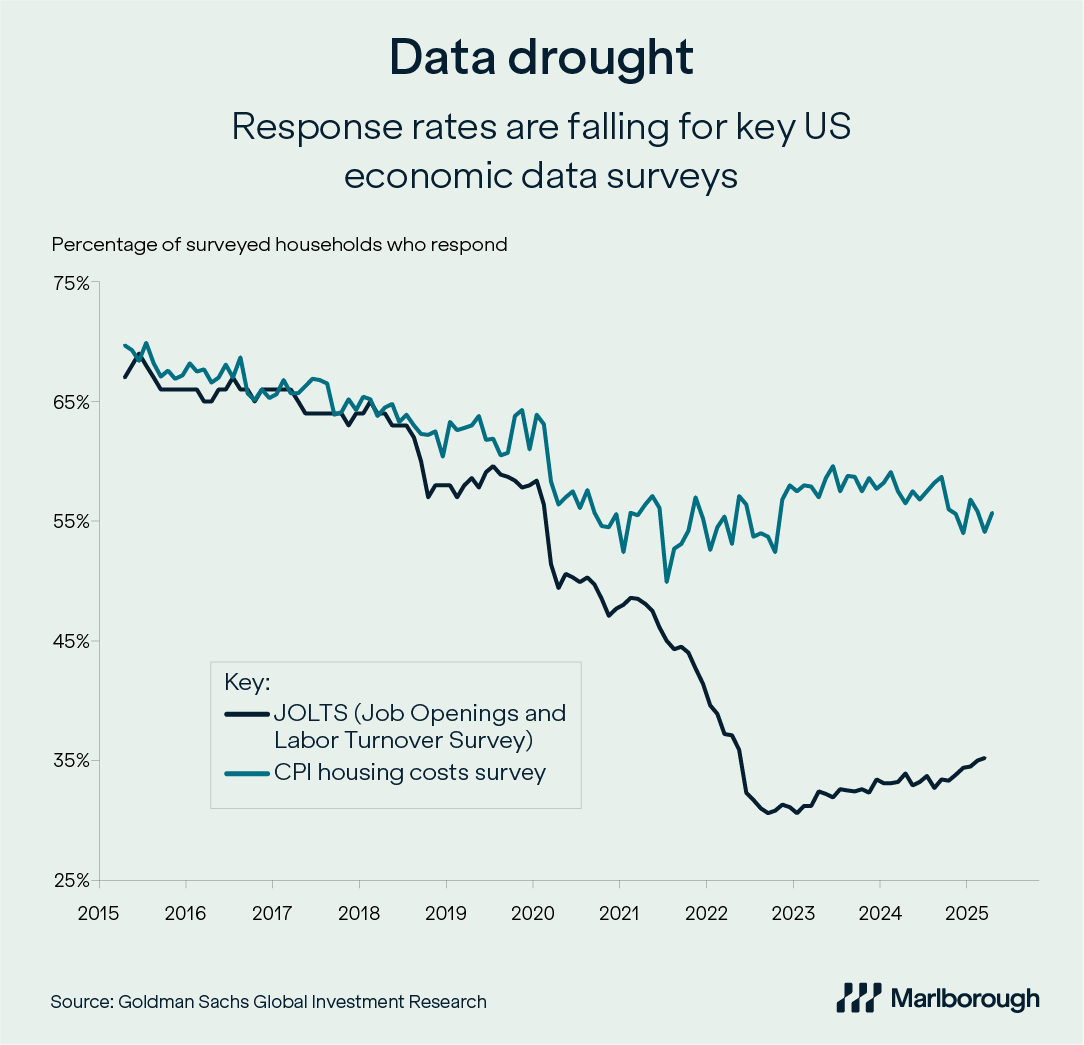
This is particularly relevant today. Some of the datasets that markets rely on, such as inflation surveys and jobs data, are showing cracks. Response rates have been falling for over a decade and this decline has accelerated since the pandemic.
As our chart shows, back in 2015, around 70% of the households selected would complete the US consumer price index (CPI) survey tracking housing costs. Today, that figure has dropped to just over 55%. Job surveys tell an even starker story. The response rate for the US Job Openings and Labor Turnover Survey (JOLTS) has fallen from close to 70% to around 35%. Not only are the data gatherers working with smaller samples, but the respondents are increasingly skewed towards older, lower-income individuals.
This matters. Just as a fantasy football league manager could struggle if they have fewer stats to pore over, working with less data creates problems for those tracking economic trends. When sample sizes fall, economic data becomes ‘noisier’ – with random fluctuations that obscure the true underlying trends. And that noise has consequences: larger revisions to job market figures, bigger errors in forecasts and greater uncertainty for policymakers and investors alike.
As an investment team, we never react to a single data point in isolation. Instead, we look for trends, cross-checking across different datasets and indicators. Whether it’s football, finance or policymaking, the lesson is the same: data is vital, but only if you can trust the source.
This article is provided for general information purposes only and should not be construed as personal financial advice to invest in any fund or product. These are the investment manager’s views at the time of writing and should not be construed as investment advice. The opinions expressed are correct at time of writing and may be subject to change. Capital is at risk. The value and income from investments can go down as well as up and are not guaranteed. An investor may get back significantly less than they invest. Past performance is not a reliable indicator of current or future performance and should not be the sole factor considered when selecting funds.

