
View
Multi-Asset


Capital is at risk. The value and income from investments can go down as well as up and are not guaranteed. An investor may get back significantly less than they invest. Past performance is not a reliable indicator of current or future performance and should not be the sole factor considered when selecting funds.
By selecting intermediary or institutional investor I confirm that I am a financial professional and understand that the information should not be distributed to or relied upon by any other persons. It’s provided for general information purposes only and is not personal advice to anyone to invest in any fund or product. Information taken from trade and other sources is believed to be reliable, although we don’t represent this as accurate or complete and it shouldn’t be relied upon as such.


Events are moving fast in the Middle East and it’s no surprise that clients are keen to understand what the escalating conflict could mean for stock markets.
While geopolitical events can understandably create uncertainty, it’s helpful to step back and understand how markets typically assess these situations. When they occur, investors tend to react quickly. That initial move is often a stock market pullback, while investors assess the potential economic consequences.
But it’s important to distinguish between a pullback and a bear market. A bear market is typically defined as a decline of 20% or more in equity markets. Historically, bear markets tend to occur when the economy enters a recession.
This means that when markets initially sell off on geopolitical headlines, investors are usually asking one simple question: could this event trigger a recession?
While recessions can have many contributing factors, they are typically triggered by one of three shocks:
• Financial shock – disruption to bond markets or banking systems
• Policy shock – aggressive interest rate rises that slow economic activity
• Energy shock – a sustained surge in oil prices that squeezes consumers and businesses
As conflict has intensified in the Middle East and oil tankers have been prevented from sailing, the oil price has risen sharply. In our update last Monday, we highlighted $100 per barrel as a key threshold. After the oil price surged past that level, it was announced G7 finance ministers would meet to discuss potentially releasing supplies from their strategic reserves, which helped to ease the price rises.
In today’s chart we’re looking again at the economic impact of the oil price. Economists often use a simple rule of thumb – every $10 increase in oil prices tends to add around 0.3% to inflation and subtract around 0.3% from US economic growth. Using a baseline of US economic growth (as measured by gross domestic product or GDP) of around 2.2% in 2025, provides a useful starting point for our analysis.
Our chart shows that even with the oil price around $100, growth would still remain positive. However, if oil were to move up to around $130 per barrel and remain at that level for an extended period, the drag on growth could become large enough to push the world’s largest economy towards recession territory. This is why markets pay such close attention to sustained oil price shocks. It’s worth emphasising though that the oil price currently remains below the $130 level.
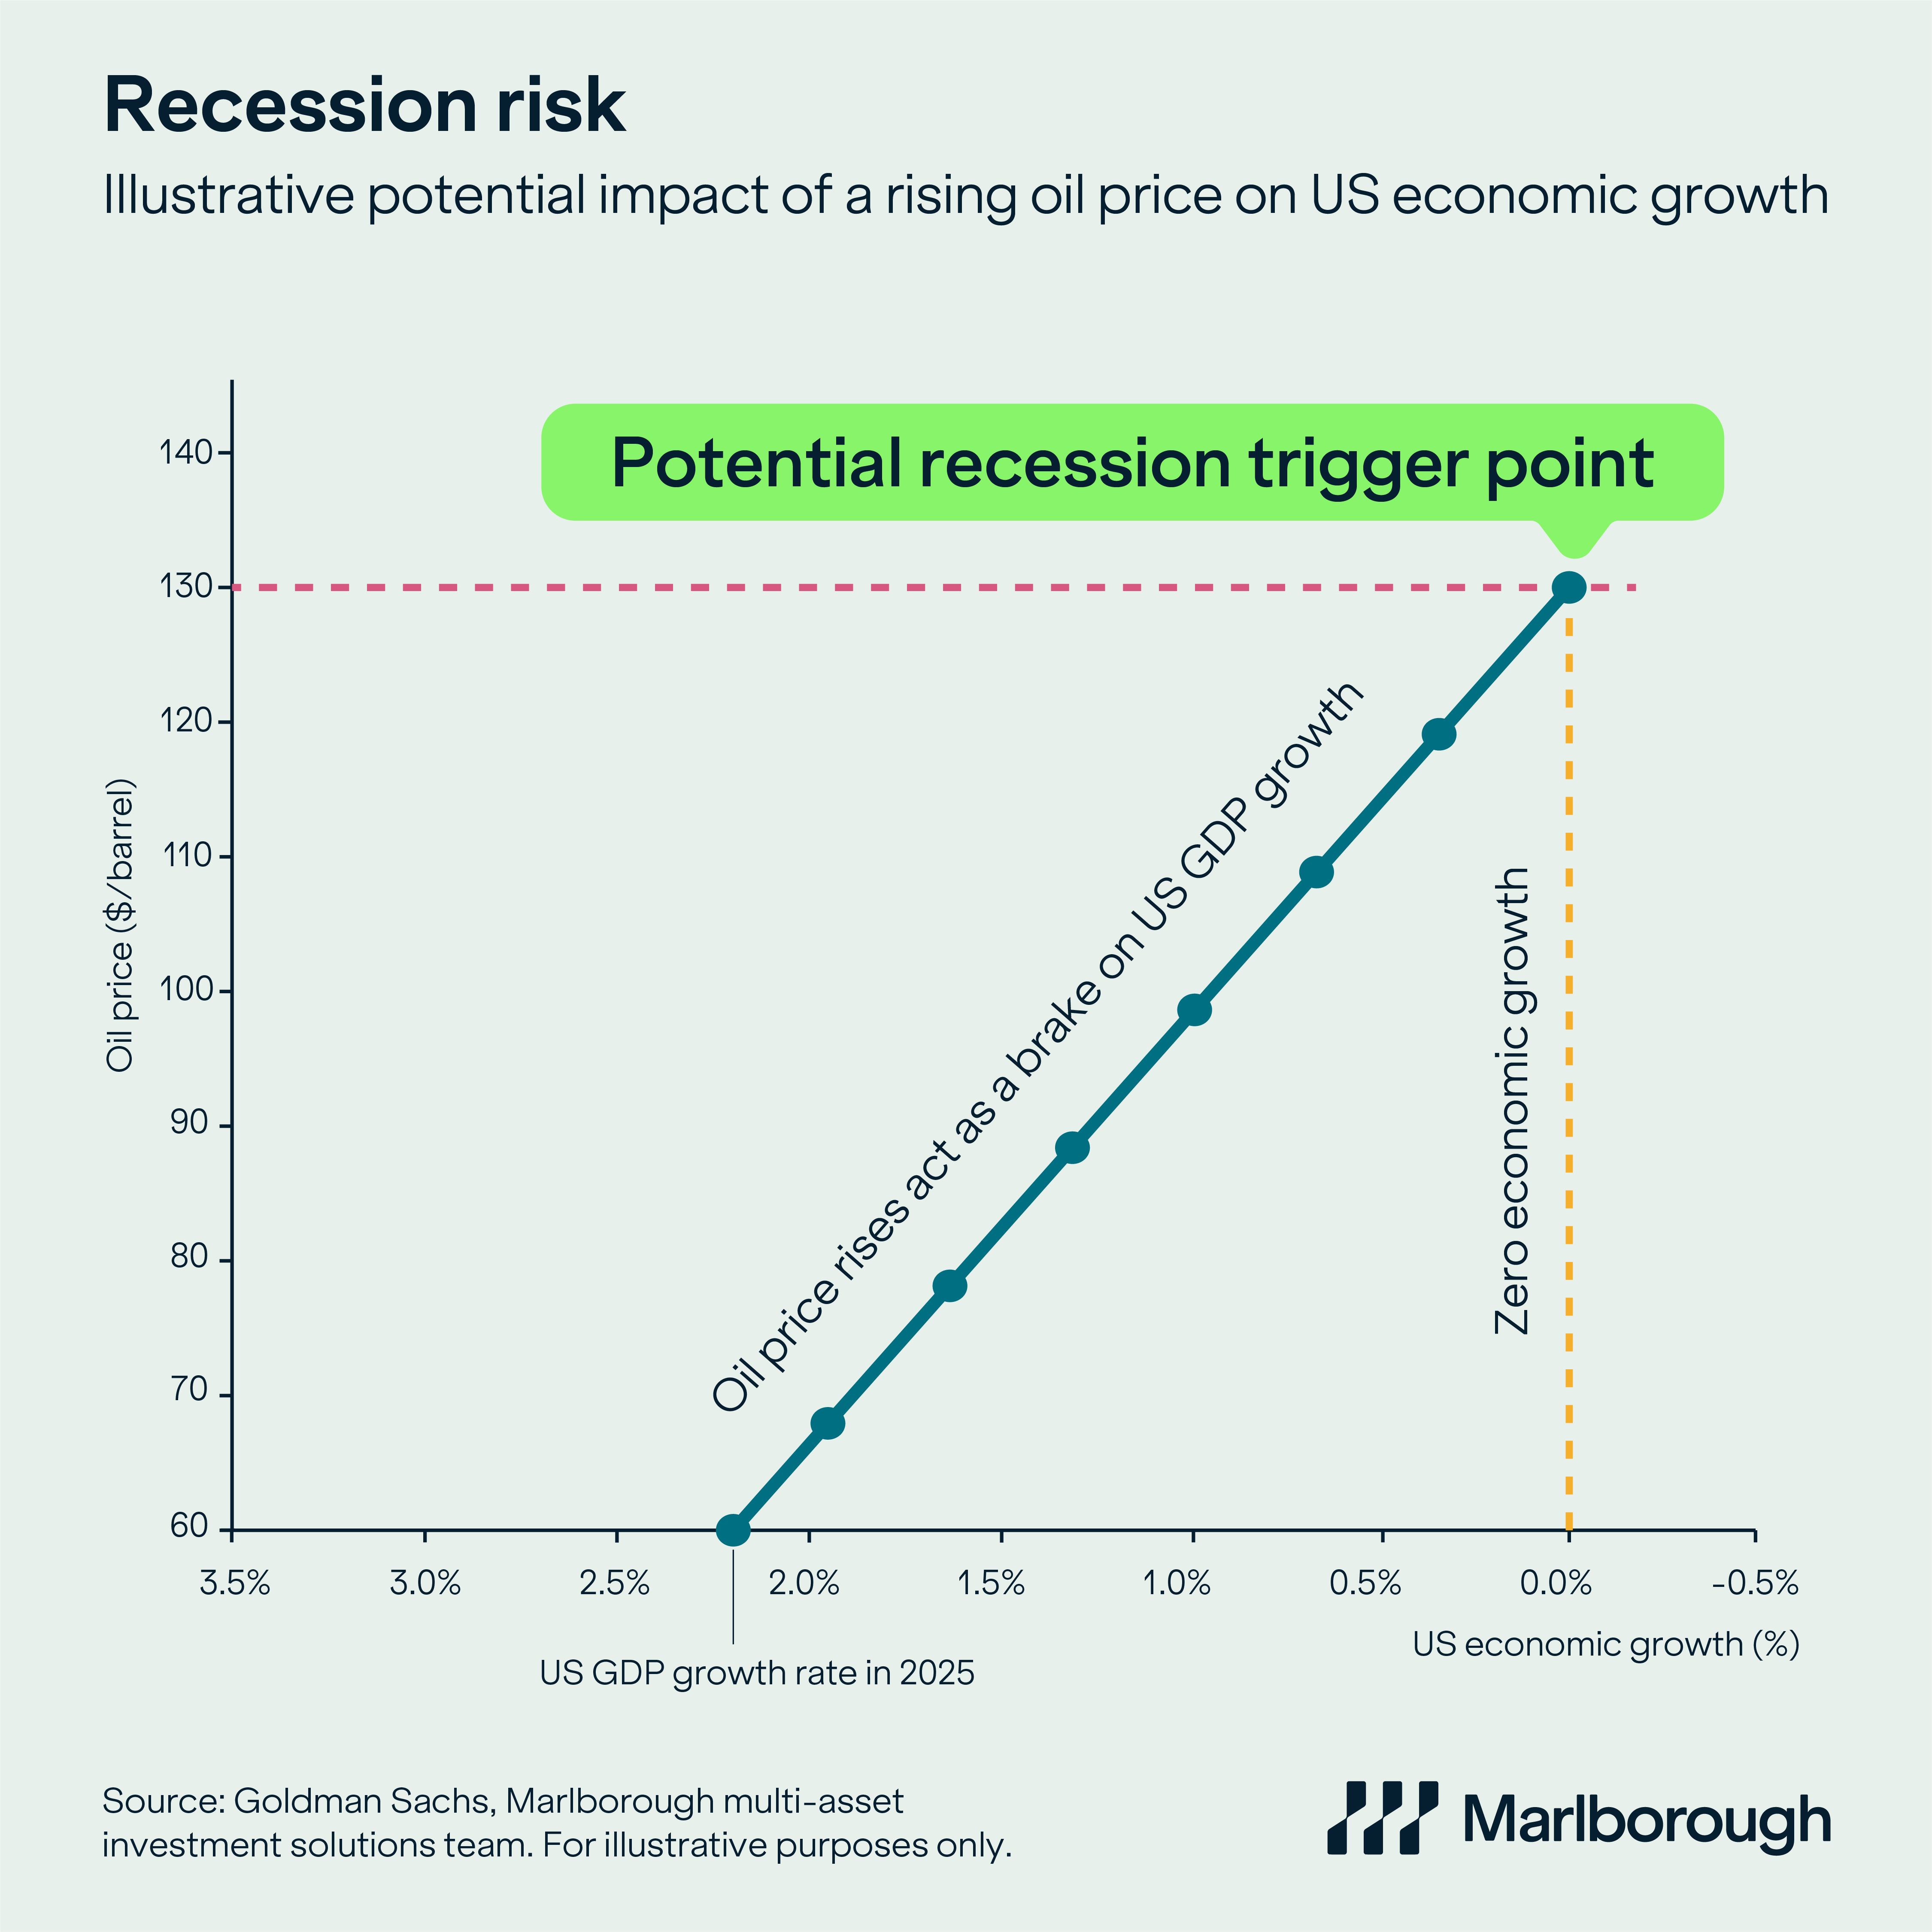
It’s also worth underlining that our chart is designed to illustrate in very broad terms how the oil price can affect economic growth, rather than being an attempt to pinpoint the exact level that would trigger a recession. The reality is the global economy has historically proven to be more resilient to oil shocks than simple models might suggest.
The G7 talks about releasing supplies from their strategic reserves underline that governments have tools available to help stabilise energy markets. In addition, central banks can support economies by lowering interest rates if higher energy prices begin to slow growth.
An important point to emphasise is that geopolitical tensions can de-escalate just as quickly as they escalate, and historically, oil prices have often fallen just as quickly as they rose once tensions begin to ease.
For investors, it’s worth remembering that while stock markets often react quickly to headlines, the global economy usually takes a much bigger shock to truly change course. Oil prices are still some way off recession-triggering levels and the economic backdrop remains resilient.
This means what’s happening in markets currently looks more like a typical geopolitical pullback, rather than the start of a bear market.
We appreciate though that market volatility can be unsettling. So, to put current events in context, we’ve provided a set of charts that show pullbacks happen from time to time and are far from unusual. The important thing is to maintain a long-term perspective to navigate these periods.
Click here to access these charts and don’t forget to check out the rest of this week’s multi-asset updates.
This article is provided for general information purposes only and should not be construed as personal financial advice to invest in any fund or product. These are the investment manager’s views at the time of writing and should not be construed as investment advice. The opinions expressed are correct at time of writing and may be subject to change. Capital is at risk. The value and income from investments can go down as well as up and are not guaranteed. An investor may get back significantly less than they invest. Past performance is not a reliable indicator of current or future performance and should not be the sole factor considered when selecting funds.

